
Yields are at multi-year highs
Across most bond segments, yields have not been this high in years. In the US currently, two-year Treasury bond yields are trading around 4.0 – 4.5 percent, while 10-year Treasuries are around 3.5 – 4.0 percent.
Figure 1: 2-year and 10-year US Treasury yields (%)
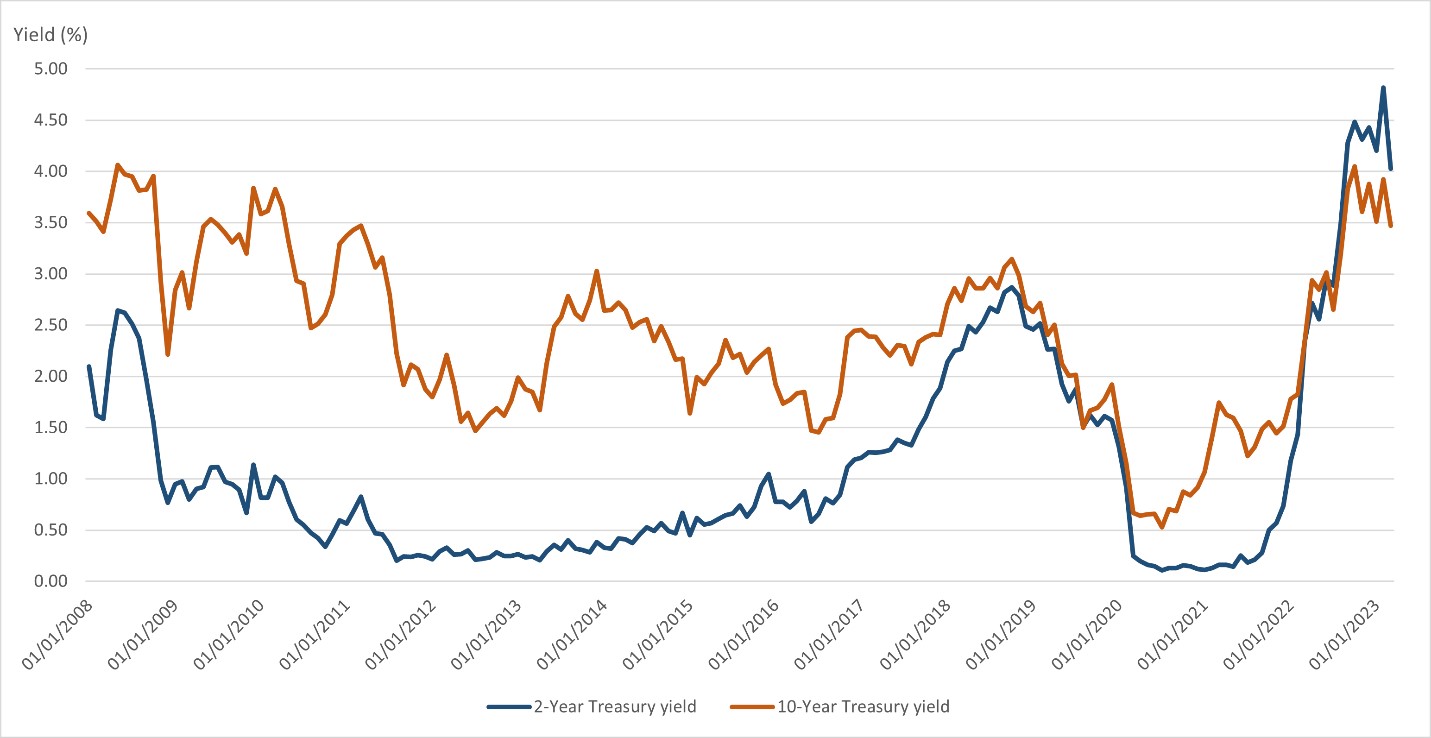
Source: Bloomberg/UOBAM Chart data from 1 Jan 2008 to 29 Mar 2023
Rate hikes set to end
US inflation numbers released yesterday did not bring any nasty surprises, and markets now seem more convinced than ever that the next rate hike will be the Fed’s last in this cycle.
The is supported by the Fed’s latest rate projection which kept the peak interest rate unchanged at 5.1 percent by year end. Following its 25-basis-point increase in March, the benchmark federal funds rate is in the 4.75 – 5.0 percent range. This implies that US interest rates are now very near their peak, with many expecting just one more 25 basis points rise in May.
Meanwhile, following a series of tightening measures, the Monetary Authority of Singapore (MAS) announced today that it will be taking a pause, contrary to some analysts’ predictions. The MAS cited the risk of a “deeper than anticipated” economic slowdown globally and in Singapore.
When will rates start to fall?
At the moment, a rate cut later this year is not the Fed’s base case. Its latest median estimates point to a 0.8 percent reduction in rates in 2024 and a 1.2 percent cut in 2025.
However, in the event of a deeper-than-expected recession, the Fed may pivot more quickly, and some analysts expect the Fed to start cutting rates this year.
In addition, markets tend to move before policy changes, and bond yields are already starting to ease ahead of rate cuts.
Singapore bond yields are falling
While still at attractive levels, Singapore Government Securities (SGS) bond yields have also been trending down since February.
Figure 2: SGS bond yields (Jan 2022 - Mar 2023)
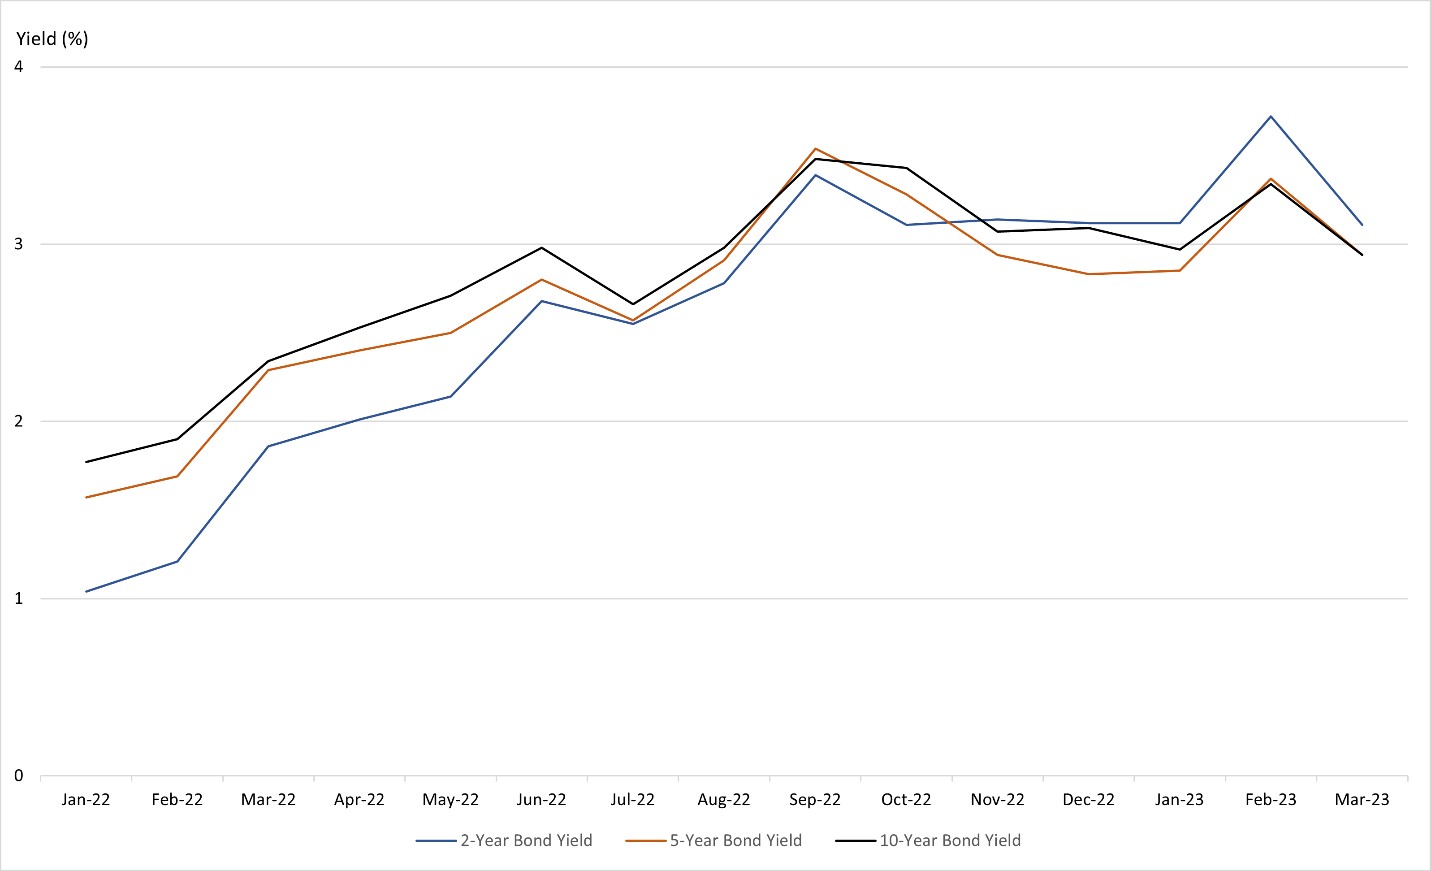
Source: Monetary Authority of Singapore
We can see a similar picture if we look at cut-off yields (i.e. the highest accepted yield of competitive bids). With US interest rate hikes expected to end soon, the cut-off yield on six-month Singapore government bonds has also been declining since hitting a high of 4.4 percent in December 2022. Today’s pause in monetary tightening will likely extend this decline.
Figure 3: 6-month T-bill cut-off yields (Jan 2022 - Mar 2023)
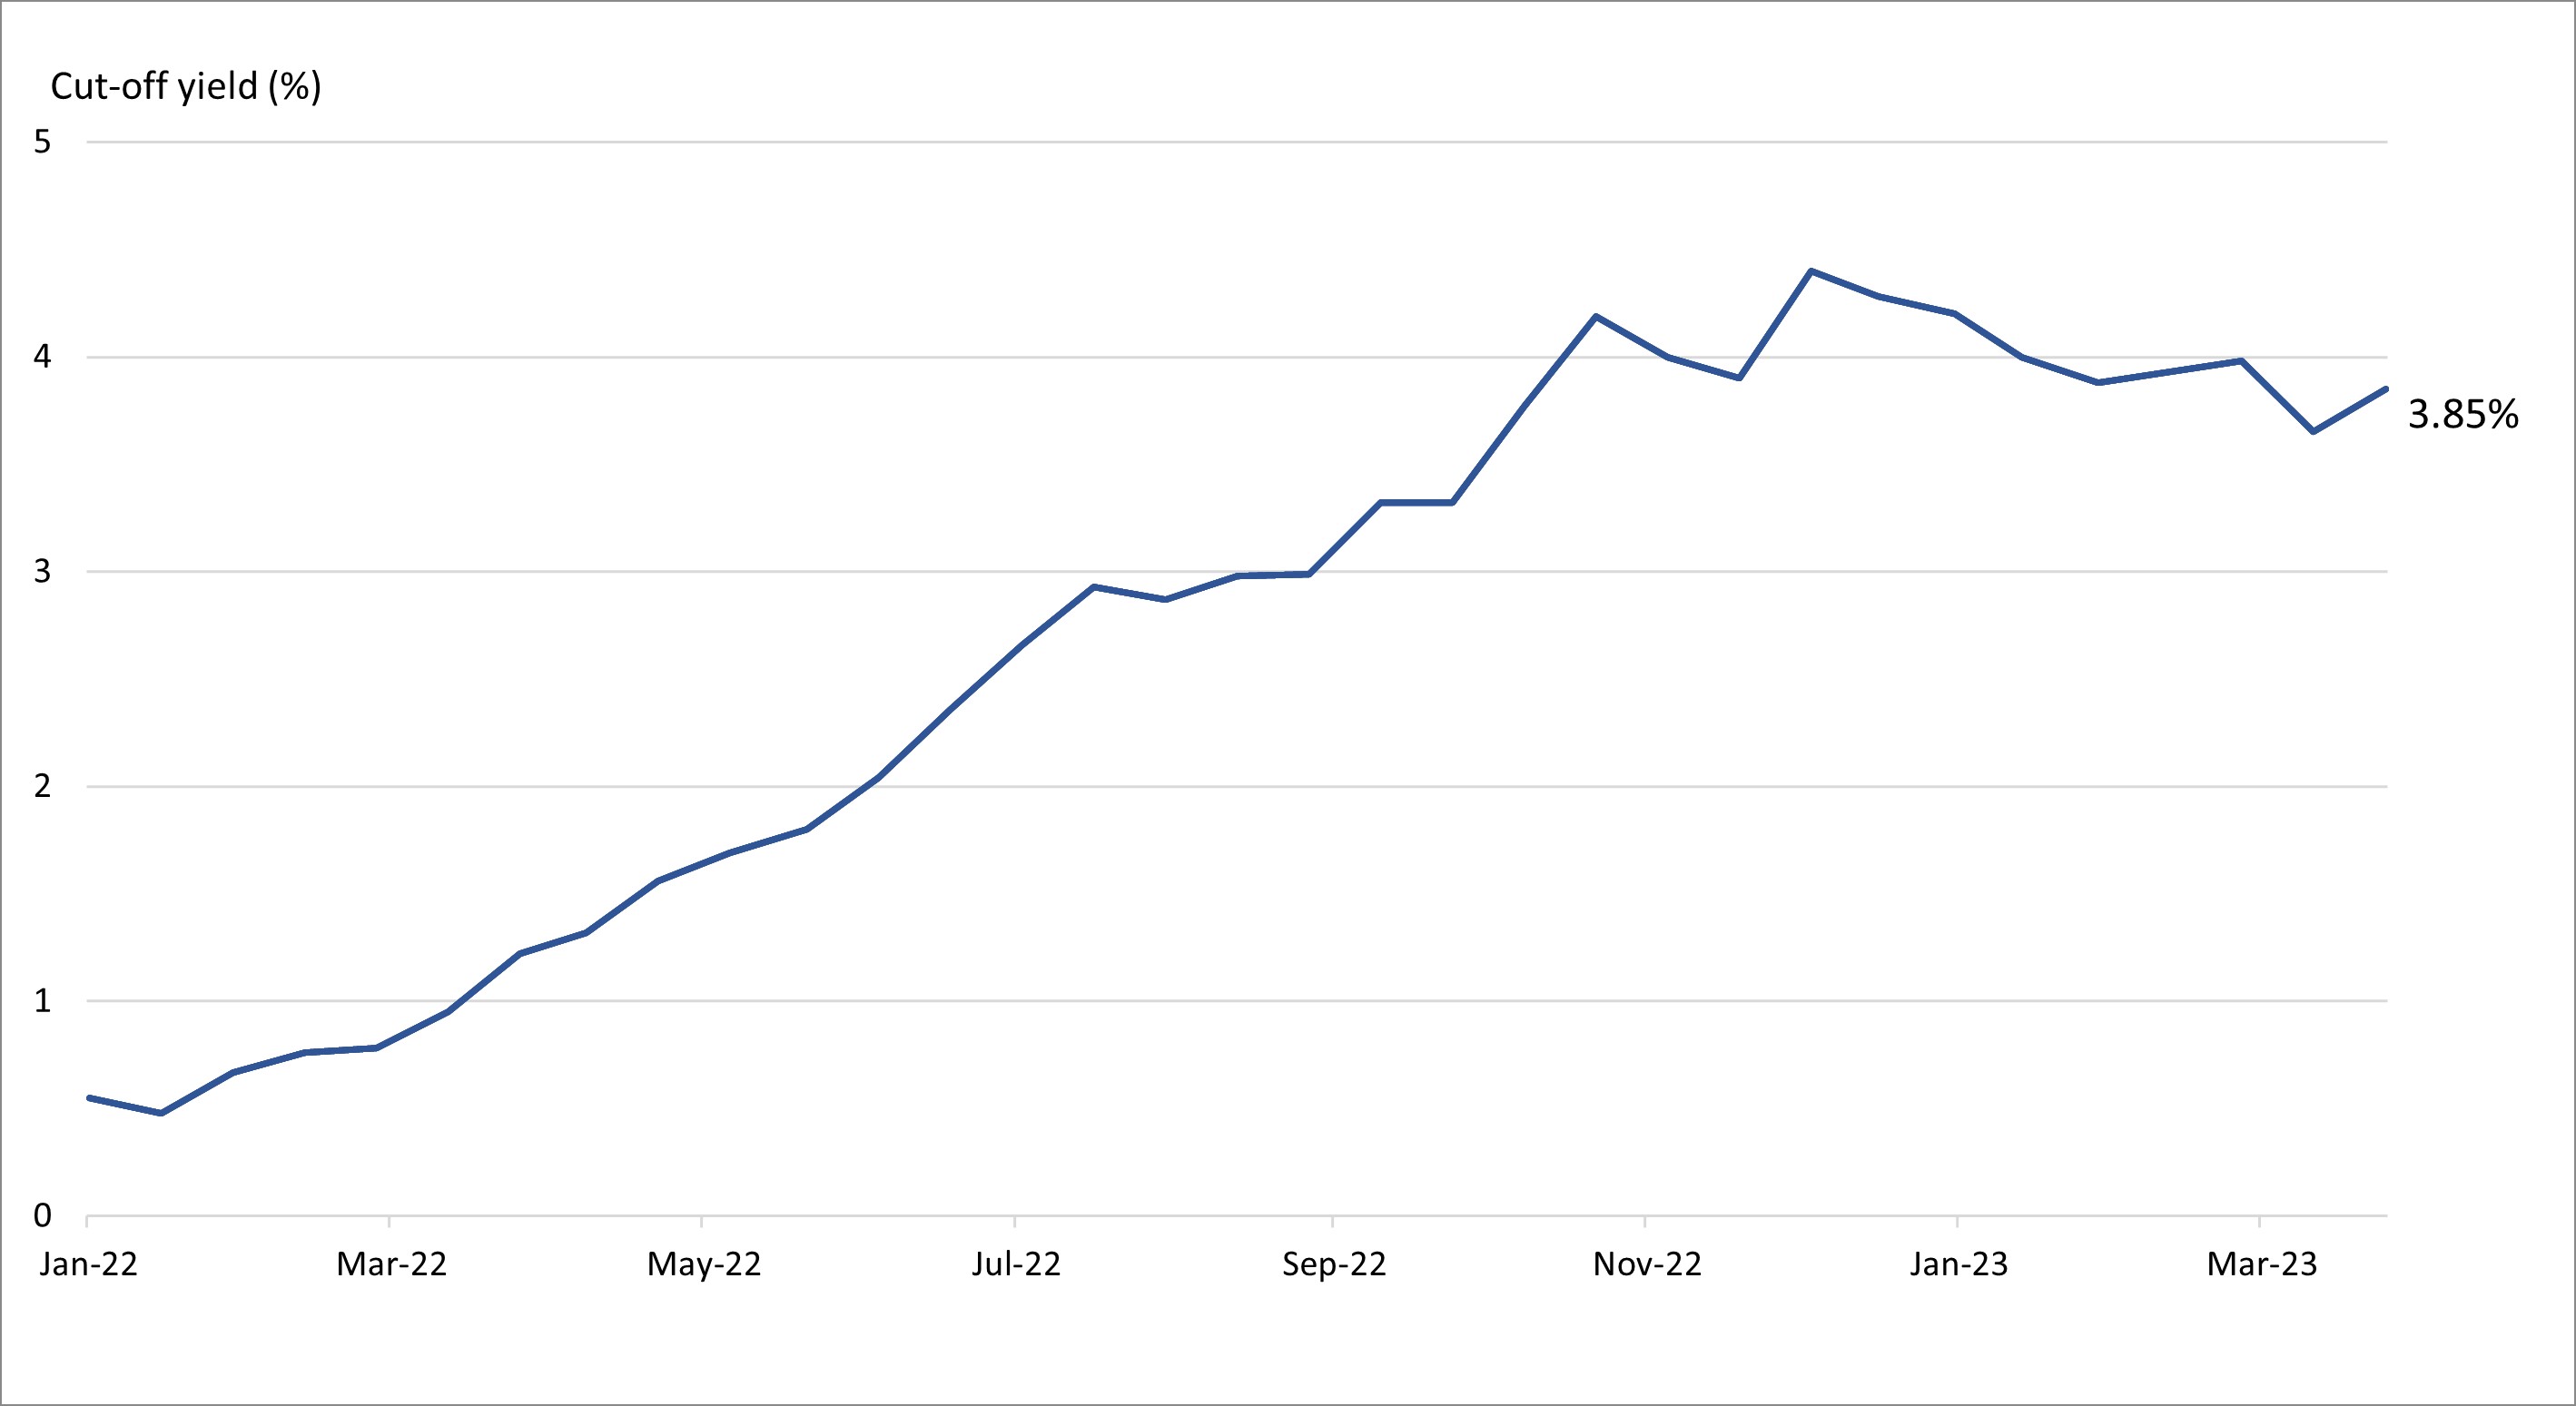
Source: Monetary Authority of Singapore
Against this backdrop, bond funds offer the opportunity to lock in higher yields and reduce reinvestment risk. This is the risk that investors run when they are not able to achieve the same level of yield once their bonds mature.
Cash is losing its appeal
Amid the banking turmoil wrought by the collapse of two US banks and the forced merger between Credit Suisse and UBS, bank deposits are looking less attractive. Fed data showed that US bank deposits have fallen dramatically since mid-2021 and are at historically low levels.
Closer to home, Singapore money market funds have also seen increased demand. In January and February 2023, Singapore money market funds drew net inflows of close to S$100 million. This is because these funds are still offering competitive yields while more liquid than fixed deposits.
Preference for high-quality bonds
In particular, investment-grade (IG) bond funds offer compelling risk-reward opportunities for investors by providing yield levels that would only have been possible previously by investing in riskier bonds.
Given the invested yield curve, very short duration funds are also seeing high investor demand. In the week of 5 April, US, European and Asian money market funds saw inflows of US$42.5 billion, US$25.6 billion and US$280 million respectively, according to Refinitiv Lipper data. This marked the sixth consecutive week of global net inflows.
UOBAM solutions
At UOBAM, we have several money market and bond fund options that range in duration and credit quality.
These funds can have exposures to both Singapore dollar (SGD) and US dollar (USD) denominated bonds in order to take advantage of the liquidity and size of the US bond market, as well as the quality and stability of SG bonds, and to maintain good currency diversification.
Our fixed income portfolio managers are also looking for opportunities to add high-quality corporate bonds for a further yield pick-up once it becomes evident that economies are headed for only a mild slowdown.
If you are interested in investment opportunities related to the theme covered in this article, here are UOB Asset Management Funds to consider:
|
This publication shall not be copied or disseminated, or relied upon by any person for whatever purpose. The information herein is given on a general basis without obligation and is strictly for information only. This publication is not an offer, solicitation, recommendation or advice to buy or sell any investment product, including any collective investment schemes or shares of companies mentioned within. Although every reasonable care has been taken to ensure the accuracy and objectivity of the information contained in this publication, UOB Asset Management Ltd (“UOBAM”) and its employees shall not be held liable for any error, inaccuracy and/or omission, howsoever caused, or for any decision or action taken based on views expressed or information in this publication. The information contained in this publication, including any data, projections and underlying assumptions are based upon certain assumptions, management forecasts and analysis of information available and reflects prevailing conditions and our views as of the date of this publication, all of which are subject to change at any time without notice. Please note that the graphs, charts, formulae or other devices set out or referred to in this document cannot, in and of itself, be used to determine and will not assist any person in deciding which investment product to buy or sell, or when to buy or sell an investment product. UOBAM does not warrant the accuracy, adequacy, timeliness or completeness of the information herein for any particular purpose, and expressly disclaims liability for any error, inaccuracy or omission. Any opinion, projection and other forward-looking statement regarding future events or performance of, including but not limited to, countries, markets or companies is not necessarily indicative of, and may differ from actual events or results. Nothing in this publication constitutes accounting, legal, regulatory, tax or other advice. The information herein has no regard to the specific objectives, financial situation and particular needs of any specific person.You may wish to seek advice from a professional or an independent financial adviser about the issues discussed herein or before investing in any investment or insurance product. Should you choose not to seek such advice, you should consider carefully whether the investment or insurance product in question is suitable for you.
UOB Asset Management Ltd. Company Reg. No. 198600120Z