

- The first week of 2024 was marked by a mild correction and increased market volatility
- Positive global equity returns this year of 8 – 10 percent still on the cards
- But markets may remain volatile amid growth and geopolitical concerns
Year-end rally
As UOBAM had accurately forecast, global equity markets closed the year with healthy rallies. The US (S&P 500) saw a 4 percent surge in December alone, bringing full-year 2023 total returns to 26 percent. European markets (EURO STOXX 50, MSCI Europe) also had a positive year with full year total returns of around 20 percent. These results are all the more impressive given the market consensus that US and European economic growth would turn negative during the course of 2023, which proved not to be the case.
A similar trend was evident in many Asian markets with Taiwan’s TAIEX index up by 25 percent, South Korea’s KOSPI market up by 17 percent, and India’s BSE SENSEX index up by 19 percent in 2023. However, falls in other markets, including China, caused Asia as a whole (MSCI Asia ex Japan) to show a more modest total return of 6 percent.
Bond markets also performed well towards the end of the year, with 10-year US Treasury yields down from a high of 5 percent in mid-Oct 2023 to 3.8 percent by end-December (bond yields and prices are inversely related - a fall in bond yields means a rise in bond prices).
Profit taking
Not surprisingly, investors have been taking some profit from this good performance. In the first week of the year, the S&P 500 corrected by 2 percent. Bonds have also corrected slightly since the start of the year, with 10-year US Treasury yields now back up to 4 percent.
After a steady decline throughout November and December, equity volatility has started to increase again, as evident from the CBOE (Chicago Board Options Exchange) VIX index chart below. VIX measures market expectations of volatility based on S&P 500 index options, and as seen in 2023, positive returns can be accompanied by significant waves of volatility.
Fig 1: CBOE VIX index, 4 Jan 2023 – 5 Jan 2024
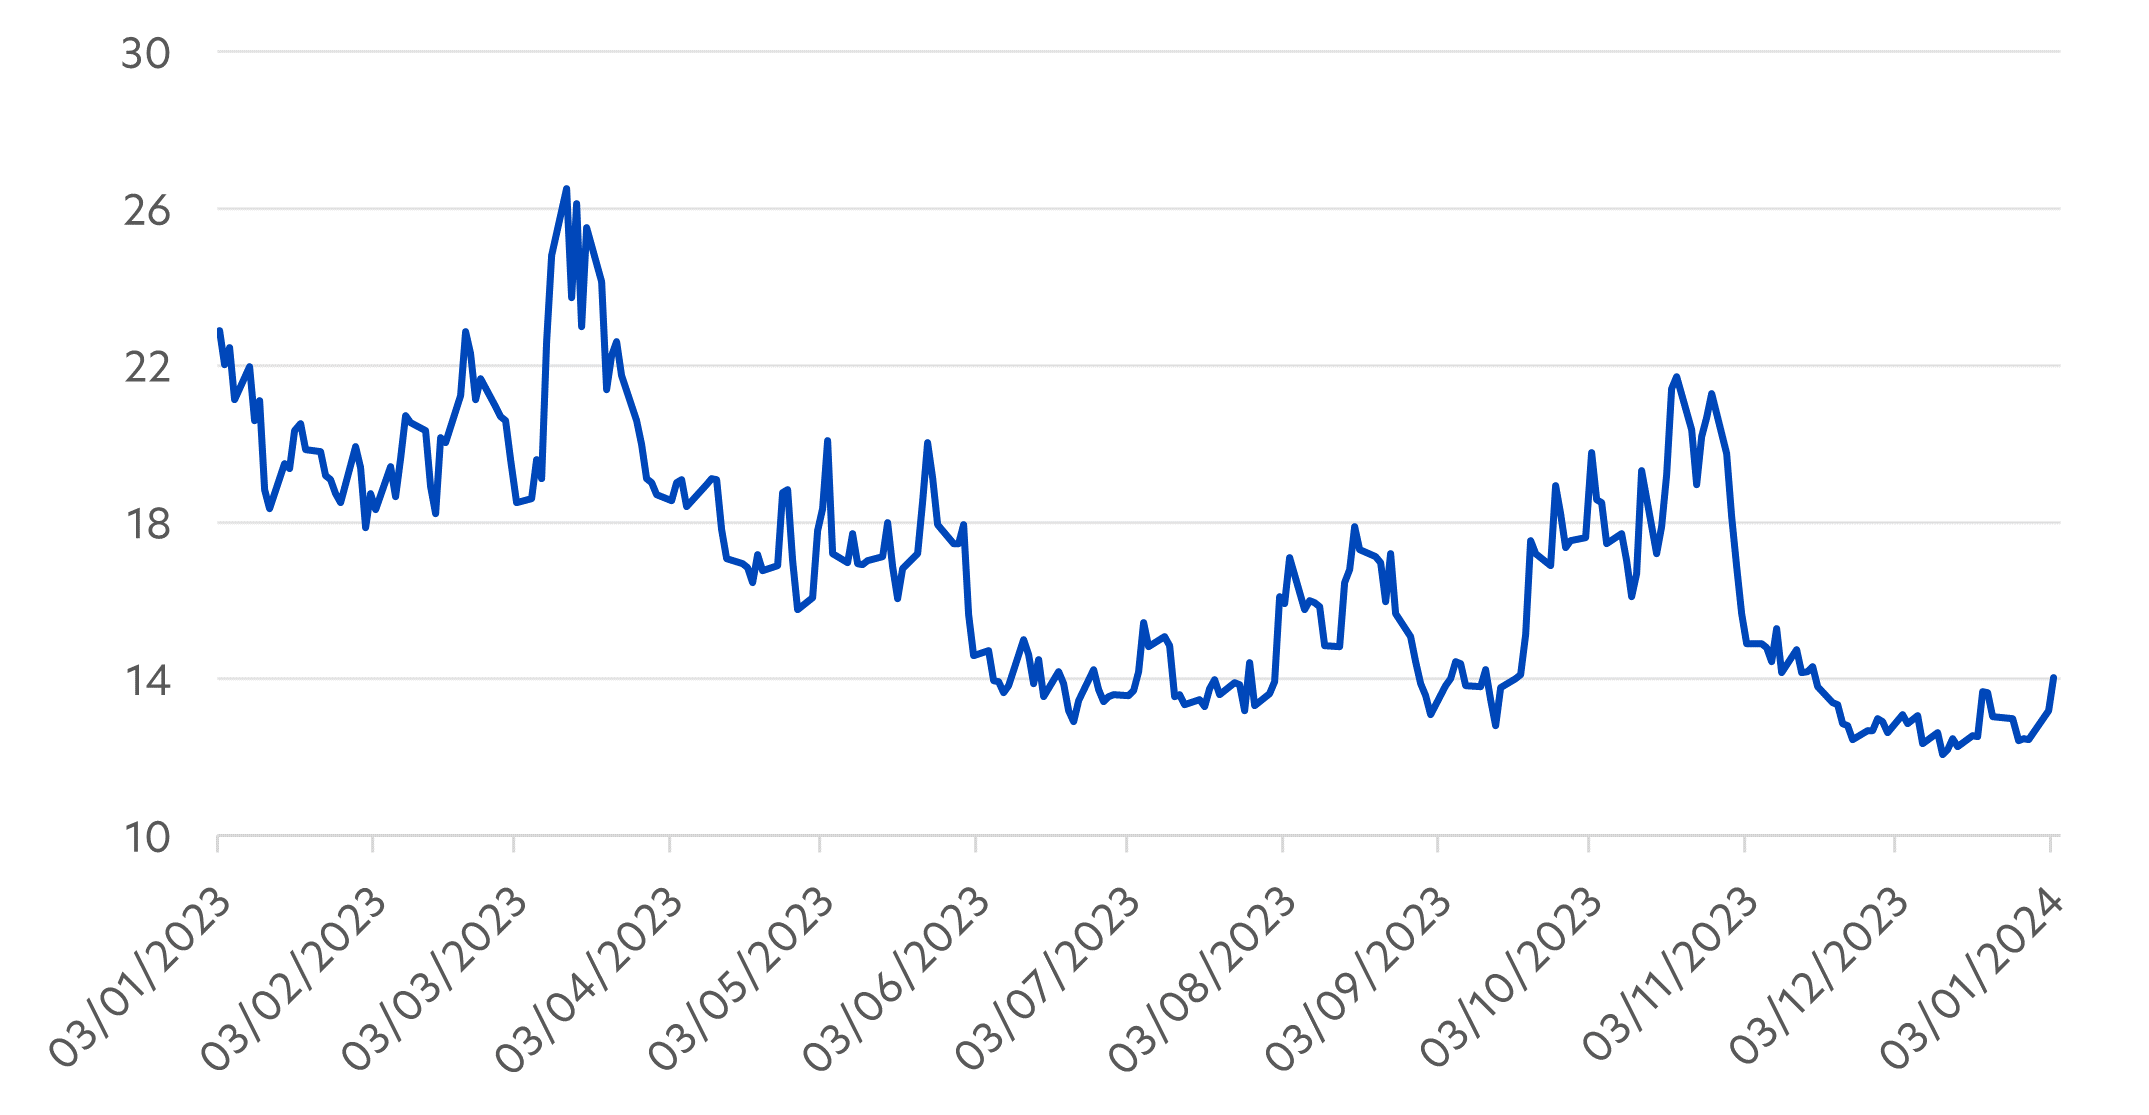
Source: Bloomberg
Short term volatility
Such waves can be expected to continue in 2024. Given the extensive calendar of elections scheduled for this year, including in Taiwan, India, Indonesia, US and Britain, election surprises can be expected to cause short term market jitters.
Additionally, in our view the world is entering a new "higher-for-longer" era. Structural forces such as demographic changes, global conflicts, and climate change look set to maintain upward pressure on inflation. These pressures will need to be kept in check by maintaining interest rates at higher levels than in the past decade.
As such, the current market forecast of up to six US interest rate cuts this year appears overly aggressive. Given that some of December’s outperformance was driven by interest rate optimism, signs of a slower-than-expected pace of rate cuts could become another driver of short term volatility.
The hard part is over
That said, the risks around inflation, rate hikes and recession have all declined. After four long years of the Covid pandemic and its aftermath, 2024 offers investors a more normal investment environment. This lays the ground for a positive year in both bond and equity markets.
We also note that investor perceptions of election impact can sometimes become over-inflated. UOBAM’s analysis of the past 20 US elections since 1948 tell us that returns tend to average about 10 percent in an election year, with only two examples - 2000 and 2008 - of negative returns.
As such, within equities, we think that earnings growth, rather than interest rates or election results, will become the primary driver of market returns this year. Developed markets should see earnings growth in the region of 8 to 10 percent and we believe that this will translate into a similar return range for developed market equities in 2024. Importantly, we expect these returns to come from a broadening of equity sectors and company size, rather than just the large-cap, tech-focused stocks.
Bond returns are also expected to be positive, driven largely by their yields. A yield range of 4 to 6 percent for 10-year US Treasuries looks reasonable to us for 2024, and as rate cuts take effect, these yields will be sufficiently ahead of cash rates to ensure good demand from investors.
Finally, investors should not ignore alternative assets like gold, commodities and real estate. More stable interest rates will help these asset classes outperform, but they also offer good hedging benefits against higher inflation and during periods of heightened equity market volatility.
If you are interested in investment opportunities related to the theme covered in this article, here is a UOB Asset Management Fund to consider:
|
This publication shall not be copied or disseminated, or relied upon by any person for whatever purpose. The information herein is given on a general basis without obligation and is strictly for information only. This publication is not an offer, solicitation, recommendation or advice to buy or sell any investment product, including any collective investment schemes or shares of companies mentioned within. Although every reasonable care has been taken to ensure the accuracy and objectivity of the information contained in this publication, UOB Asset Management Ltd (“UOBAM”) and its employees shall not be held liable for any error, inaccuracy and/or omission, howsoever caused, or for any decision or action taken based on views expressed or information in this publication. The information contained in this publication, including any data, projections and underlying assumptions are based upon certain assumptions, management forecasts and analysis of information available and reflects prevailing conditions and our views as of the date of this publication, all of which are subject to change at any time without notice. Please note that the graphs, charts, formulae or other devices set out or referred to in this document cannot, in and of itself, be used to determine and will not assist any person in deciding which investment product to buy or sell, or when to buy or sell an investment product. UOBAM does not warrant the accuracy, adequacy, timeliness or completeness of the information herein for any particular purpose, and expressly disclaims liability for any error, inaccuracy or omission. Any opinion, projection and other forward-looking statement regarding future events or performance of, including but not limited to, countries, markets or companies is not necessarily indicative of, and may differ from actual events or results. Nothing in this publication constitutes accounting, legal, regulatory, tax or other advice. The information herein has no regard to the specific objectives, financial situation and particular needs of any specific person. You may wish to seek advice from a professional or an independent financial adviser about the issues discussed herein or before investing in any investment or insurance product. Should you choose not to seek such advice, you should consider carefully whether the investment or insurance product in question is suitable for you..
This advertisement or publication has not been reviewed by the Monetary Authority of Singapore.