

- US inflation numbers released this week point to the end of the rate hike cycle
- This good news comes on top of November’s increased market optimism
- The positive shift in investor sentiment could last till the end of the year
Easing US Inflationary pressures
Against expectations of a small rise in inflation, Tuesday’s consumer price index (CPI) data showed that inflation in October did not rise compared to the previous month, and rose by only 3.2 percent from a year ago. This was helped by falling energy prices, but even excluding energy and food, core CPI rose just 0.2 percent month-on-month and 4.0 percent year-on-year.
In fact, most sectors of the US economy except for rents have been showing an easing trend since April this year. Therefore even though inflation remains above the US Fed’s stated 2 percent target, market watchers have ruled out any further rate hikes. The debate has effectively moved from how many more rate hikes to how many rate cuts next year, with many forecasting between two to four.
A positive November
This good news has been greeted with enthusiasm. In the US, markets rallied by 1.9 percent, bringing S&P500 returns for the first two weeks of November to an impressive 9.0 percent. The index is now back to levels last seen in July, and only about 200 points away from its all-time high reached in December 2021.
The same cheer was reflected around the world. In Europe, the Stoxx600 index surged by 1.3 percent. In Asia, the Hang Seng, Kospi and Shanghai Composite indices were all up by 3.9, 2.2, and 0.6 percent respectively. Even in Japan, which reported a surprisingly large third quarter economic contraction of 2.1 percent year-on-year, the Nikkei 225 index still managed to close the day in positive territory.
As a result, November has proved to be a positive month so far for global markets, with the MSCI All Country World Index (ACWI) now showing a positive performance of 6.5 percent for the month so far, and delivering 32.5 percent total returns since the start of the Covid pandemic on 30 January 2020.
Fig 1: Global Equities, 1 Jan 2020 – 15 Nov 2023
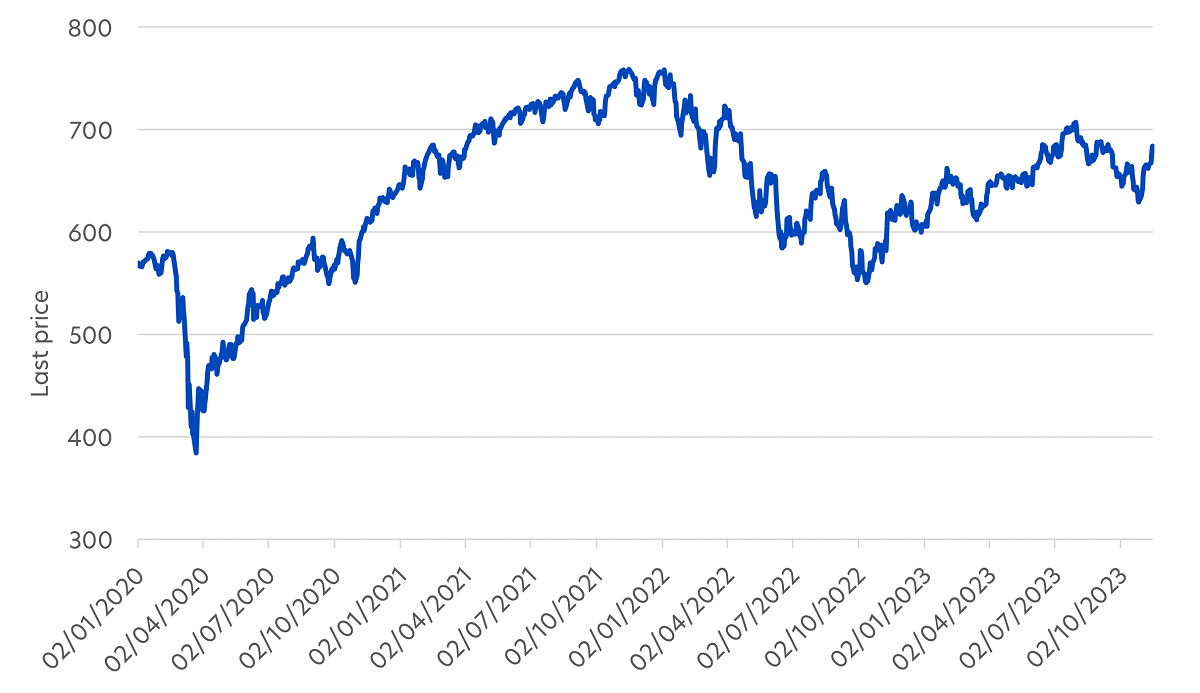
Source: Bloomberg, global equities represented by MSCI ACWI
Will December follow suit?
There are a few reasons to think that November’s optimism could last till the end of the year, as was the case in 2021. Importantly, interest rate uncertainties have kept many investors on the sidelines, and caused them to miss out on some or all of the 15+ percent US equity returns so far this year. This week’s widespread agreement that US has concluded its rate hiking cycle could persuade investors to make a last-minute dash back to the markets. This applies especially to investors with large institutional mandates, who will be keen to recover at least some of their lost opportunities.
Furthermore, although not necessarily borne out by historical data, investors are often wary of investing in September and October, in what is commonly known as the “October effect”. Correspondingly, investors are thought to pile back into markets towards the close of the year, also referred to as the “Santa Claus rally”. Although unsubstantiated if we look at the past century, this year’s market corrections in September and October and rally in November do seem to support these seasonality factors.
How long can the feel-good factor last?
Going into 2024, there are some further tailwinds at play. Third quarter US company earnings reports so far have been very encouraging. According to the London Stock Exchange Group (LSEG), third quarter earnings by S&P500-listed companies are estimated to be 6.3 percent higher than the same time last year, well above expectations.
Analysts believe this strong earnings performance can be replicated in other markets and as such, the consensus earnings forecast for 2024 is for 11 percent year-on-year growth in the US and over 20 percent in Asia. This level of earnings optimism looks solid enough to drive global equity markets into the early part of next year.
Meanwhile, the most bearish market analysts may be reassessing their views. Those who had believed strongly in the likelihood of a US recession this year or early next year may not be as convicted if economic growth remains stable to the end of the year. This is turn would help support sentiment as we progress into the first few months of 2024.
If you are interested in investment opportunities related to the theme covered in this article, here is a UOB Asset Management Fund to consider:
|
MSCI Data are exclusive property of MSCI. MSCI Data are provided “as is”, MSCI bears no liability for or in connection with MSCI Data. MSCI full disclaimer here.
This publication shall not be copied or disseminated, or relied upon by any person for whatever purpose. The information herein is given on a general basis without obligation and is strictly for information only. This publication is not an offer, solicitation, recommendation or advice to buy or sell any investment product, including any collective investment schemes or shares of companies mentioned within. Although every reasonable care has been taken to ensure the accuracy and objectivity of the information contained in this publication, UOB Asset Management Ltd (“UOBAM”) and its employees shall not be held liable for any error, inaccuracy and/or omission, howsoever caused, or for any decision or action taken based on views expressed or information in this publication. The information contained in this publication, including any data, projections and underlying assumptions are based upon certain assumptions, management forecasts and analysis of information available and reflects prevailing conditions and our views as of the date of this publication, all of which are subject to change at any time without notice. Please note that the graphs, charts, formulae or other devices set out or referred to in this document cannot, in and of itself, be used to determine and will not assist any person in deciding which investment product to buy or sell, or when to buy or sell an investment product. UOBAM does not warrant the accuracy, adequacy, timeliness or completeness of the information herein for any particular purpose, and expressly disclaims liability for any error, inaccuracy or omission. Any opinion, projection and other forward-looking statement regarding future events or performance of, including but not limited to, countries, markets or companies is not necessarily indicative of, and may differ from actual events or results. Nothing in this publication constitutes accounting, legal, regulatory, tax or other advice. The information herein has no regard to the specific objectives, financial situation and particular needs of any specific person. You may wish to seek advice from a professional or an independent financial adviser about the issues discussed herein or before investing in any investment or insurance product. Should you choose not to seek such advice, you should consider carefully whether the investment or insurance product in question is suitable for you.
This publication has not been reviewed by the Monetary Authority of Singapore.
UOB Asset Management Ltd. Company Reg. No. 198600120Z