

Asian markets show resilience

Colin Ng
Head of Asia Equities

Paul Ho
Head of Investment Technology
Manager Comments
Positive momentum across most Asian equities
Positive sentiment driven by an easing of tariff fears led to good gains in Taiwan, Korea, Hong Kong and China. As a result, the MSCI All Country Asia Ex-Japan index rose 4.7 percent (SGD terms) in July. However, India continued to lag, ending the month as the worst-performing market in the region.
China equities were up 7 percent in July, supported by strong economic data and a cooling of US-China tensions. The government reported GDP growth of 5.3 percent year-over-year for the first half of 2025, despite prior worries about a weakening economy. This growth was underpinned by robust exports and frontloaded policy easing. While trade talks with the US concluded without major breakthroughs, the deadline has since been officially extended by another 90 days. Southbound flows remained strong, providing support to China H-shares listed in Hong Kong.
Hong Kong's market, particularly in the H-shares segment, closely mirrored China’s performance. Investor sentiment improved significantly following news that Nvidia received US government approval to resume shipments of its H20 chips, reversing earlier export restrictions. This led to a sharp rally in bellwether tech stocks such as Alibaba and Tencent.
South Korea continued its strong run, driven by strong exports especially in the semiconductor sector. Both SK Hynix and Samsung Electronics, two index heavy weights, posted better-than-expected earnings, fuelled by strong demand for High Bandwidth Memory (HBM) used in AI applications. Toward the end of the month, Korean equities received an additional boost from news that tariff rates with the US would be fixed at 15 percent, at the lower end of global rates. A weaker US dollar and strengthening Korean won further supported capital inflows.
Taiwan’s equity market gained 7.6 percent, buoyed by continued strength in the semiconductor sector and resilient export demand, as optimism around AI remained strong.
India saw another month of underperformance in July, declining 3.1 percent. This was driven by a series of weak corporate earnings, particularly in large cap IT and financials, reflecting broader concerns about global tech spending amid recession fears in the US and Europe.
Foreign investors continued to pull capital out of Indian equities. In addition, Trump tariffs added uncertainty, especially on export heavy sectors such as pharmaceuticals, chemicals and textiles.
Mixed performance for ASEAN markets
ASEAN markets delivered mixed results in July. Thailand was the best performing market in July, up 16.3 percent, as news of a ceasefire between Thailand and Cambodia provided relief to investors. Foreign inflows also started picking up as investors priced in the likelihood that the worst may be over after Prime Minister Paetongtarn’s resignation in the wake of the phone leak scandal.
Singapore equities rose steadily after the Monetary Authority of Singapore (MAS) announced it had awarded S$1.1 billion to three fund managers to boost investments especially in the small and mid-cap space.
Philippine stocks declined, led by weakness in large-cap consumer names within the index. Meanwhile, Indonesia and Malaysia markets were flat for the month with little significant newsflow.
AI-Augmented Asia Solutions

United Asia Fund
July Performance: Fund rose 1.73 percent
| 1M | 1Y | 3Y | |
| United Asia Fund | 1.73% | -0.80% | 5.36% |
| Benchmark | 4.47% | 16.35% | 8.28% |
Source: Morningstar. Performance as of 31 July 2025, SGD basis, with dividends and distributions reinvested, if any. Fund refers to United Asia Fund – A SGD Acc. Benchmark: April 1992 – December 2011: MSCI AC FE ex-Japan; January 2012 to present: MSCI AC Asia ex-Japan. Performance figures for 1 month till 1 year show the per cent change, while performance figures above 1 year show the average annual compounded returns.
- The Fund rose 1.73 percent in the month of July, underperforming its benchmark by 2.74 percent. This marked its largest single-month underperformance since September 2024 due to profit-taking in some of the portfolio’s top stocks.
- In July, we maintained our overweight positions in China and Hong Kong, driven primarily by our bottom-up stock selection. However, having strongly benefited in recent months from our exposure to China’s “New Consumption” names such as Laopu Gold and Pop Mart, these stocks experienced a notable pullback in July. This negatively impacted the Fund’s performance, despite having trimmed our positions ahead of the correction.
- Nevertheless, we continue to have a favorable outlook on the companies’ fundamentals and are now well-positioned to rebuild our exposure at more attractive levels.
- The Fund was also impacted by a sharp sell-off in a Philippine gaming stock, following a Senator’s announcement of a proposed bill to tighten industry regulations. However, there was eventually no follow-up when Congress convened.
- Looking ahead, we believe that in an environment of global economic uncertainty and slowing growth, companies with strong business models, healthy cash flows and that pay good dividends will hold scarcity value. As such, once short-term overbought sentiments have been worked off, we expect investors to rotate back into these stocks. Also, declining bond yields in China mean that many institutional investors (such as insurance companies) have started allocating more money from bonds into these stocks.
- We continue to see compelling medium-term opportunities in South Korea, where we are selectively positioned in technology, financials, industrials, and consumer sectors trading at attractive valuations. Korea’s ongoing “Value Up” corporate reforms could help narrow the valuation gap for deeply discounted companies, similar to the impact of Japan’s reforms during the Abe administration.
Rebalancing: Tweaks across Hong Kong, China, Taiwan
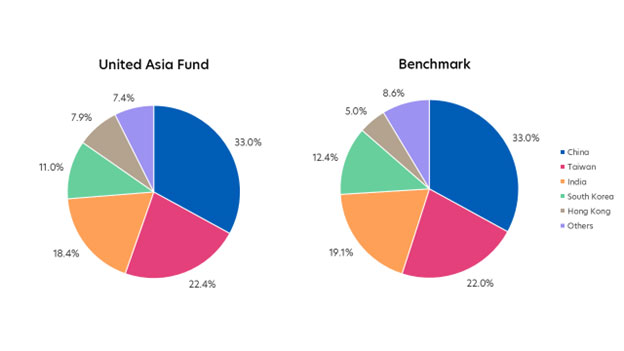
Source: Morningstar. Portfolio rebalancing as of 31 July 2025. Benchmark allocation as of 31 July 2025
- This month we continue to make minor adjustments to our holdings in HK, China and Taiwan, replacing some old names with new ones and taking profit in some of our recent winners that outperformed. We are also looking to add back exposure to names like Laopu Gold and Pop Mart, which had previously sold off.
Click here for more details on the Fund above.

United Greater China Fund
July Performance: Fund gained 4.43 percent
| 1M | 1Y | 3Y | |
| United Greater China Fund | 4.43% | 14.33% | 5.37% |
| Benchmark | 6.99% | 31.58% | 9.70% |
Source: Morningstar. Performance as of 31 July 2025, SGD basis, with dividends and distributions reinvested, if any. Fund refers to United Greater China Fund – A SGD Acc. Benchmark: MSCI Golden Dragon Index. Performance figures for 1 month till 1 year show the per cent change, while performance figures above 1 year show the average annual compounded returns.
- The Fund was up 4.43 percent in July, underperforming its benchmark which rose 6.99 percent, for the same reasons as mentioned above.
- In line with our approach for the United Asia Fund, we have started buying back select names such as Laopu Gold and Pop Mart, after having taken profits earlier in the month near their recent highs.
Rebalancing: Tweaks across Hong Kong, China, Taiwan
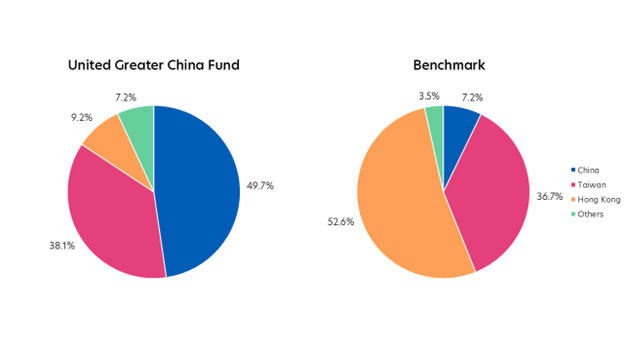
Source: Morningstar. Portfolio rebalancing as of 31 July 2025. Benchmark allocation as of 31 July 2025
- This month we continue to make minor adjustments to our holdings in HK, China and Taiwan, replacing some old names with new ones and taking profit in some of our recent winners that outperformed. We are also looking to add back exposure to names like Laopu Gold and Pop Mart, which had previously sold off.
Click here for more details on the Fund above.

United ASEAN Fund
July Performance: Fund rose 1.61 percent
| 1M | 1Y | 3Y | |
| United ASEAN Fund | 1.61% | 11.31% | 5.23% |
| Benchmark | 3.91% | 13.40% | 6.15% |
Source: Morningstar. Performance as of 31 July 2025, SGD basis, with dividends and distributions reinvested, if any. Fund refers to United ASEAN Fund – A SGD Acc. Benchmark: Jun 86 - Jan 93: 100% DBS 50; Feb 93 - Aug 98: 50% DBS 50, 50% KLEMAS; Sep 98 - May 00: 100% DBS 50; June 00 - May 06: 50% STI Index, 50% KLEMAS; June 06 - June 13: 50% STI Index, 50% KLCI; Jul 13 - present: MSCI ASEAN. Performance figures for 1 month till 1 year show the per cent change, while performance figures above 1 year show the average annual compounded returns.
- In July, the Fund’s return of 1.61 percent underperformed the benchmark return of 3.91 percent.
- The region saw a minor unexpected relief rally given that Thailand and Malaysia managed to negotiate down the tariff rate in exchange for some concessions to the US.
- In terms of fund contributors and detractors, the top contributors on a relative basis were DFI Retail Group, Airports of Thailand and Keppel Ltd. The share price of DFI Retail Group was boosted by the announcement of a special dividend in its results.
- On the other hand, Digiplus Interactive and the fund’s underweight positions in Delta Electronics and DBS were the key detractors. Digiplus’s share price was weighed down by uncertainties over the regulation of online gaming in the Philippines. We see the possibility of tighter regulations for online gaming in the Philippines, although the worst case scenario of a total ban is unlikely. In our view, the government could take a more pragmatic approach given the tax revenue contribution from online gaming. Furthermore, a total ban could drive the industry underground, making it more difficult to regulate.
- Looking ahead, with reciprocal tariffs determined and lowered in a few cases, this is expected to ease the pressure of foreign portfolio outflows from ASEAN. We are looking at bargain hunting opportunities especially in sectors like consumer and healthcare in laggard markets like Indonesia and Thailand. We would continue to focus on domestic/regional centric companies to mitigate the direct effects from US tariffs.
- Bank Syariah Indonesia, Digiplus Interactive and Converge Information were the key detractors.
Rebalancing: Continued focus on domestic sectors
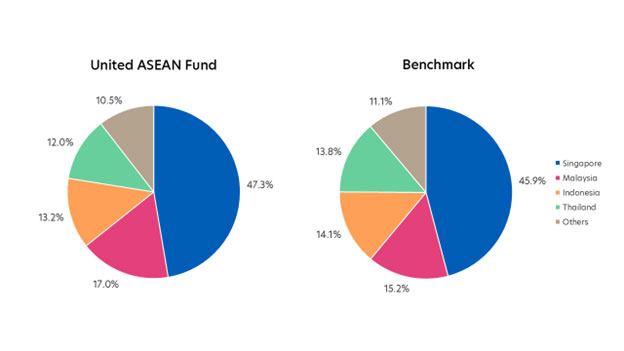
Source: Morningstar. Portfolio rebalancing as of 31 July 2025. Benchmark allocation as of 31 July 2025
- This month we are continuing to focus on domestic/regional centric companies to mitigate the direct effects from US tariffs.
Click here for more details on the Fund above.
MSCI Data are exclusive property of MSCI. MSCI Data are provided “as is”, MSCI bears no liability for or in connection with MSCI Data. MSCI full disclaimer here.
All information in this publication is based upon certain assumptions and analysis of information available as at the date of the publication and reflects prevailing conditions and UOB Asset Management Ltd (“UOBAM”)'s views as of such date, all of which are subject to change at any time without notice. Although care has been taken to ensure the accuracy of information contained in this publication, UOBAM makes no representation or warranty of any kind, express, implied or statutory, and shall not be responsible or liable for the accuracy or completeness of the information.
Potential investors should read the prospectus of the fund(s) (the “Fund(s)”) which is available and may be obtained from UOBAM or any of its appointed distributors, before deciding whether to subscribe for or purchase units in the Fund(s). Returns on the units are not guaranteed. The value of the units and the income from them, if any, may fall as well as rise, and is likely to have high volatility due to the investment policies and/or portfolio management techniques employed by the Fund(s). Please note that the graphs, charts, formulae or other devices set out or referred to in this document cannot, in and of itself, be used to determine and will not assist any person in deciding which investment product to buy or sell, or when to buy or sell an investment product. An investment in the Fund(s) is subject to investment risks and foreign exchange risks, including the possible loss of the principal amount invested. Investors should consider carefully the risks of investing in the Fund(s) and may wish to seek advice from a financial adviser before making a commitment to invest in the Fund(s). Should you choose not to seek advice from a financial adviser, you should consider carefully whether the Fund(s) is suitable for you. Investors should note that the past performance of any investment product, manager, company, entity or UOBAM mentioned in this publication, and any prediction, projection or forecast on the economy, stock market, bond market or the economic trends of the markets is not necessarily indicative of the future or likely performance of any investment product, manager, company, entity or UOBAM or the economy, stock market, bond market or economic trends of the markets. Nothing in this publication shall constitute a continuing representation or give rise to any implication that there has not been or that there will not be any change affecting the Funds. All subscription for the units in the Fund(s) must be made on the application forms accompanying the prospectus of that fund.
The above information is strictly for general information only and is not an offer, solicitation advice or recommendation to buy or sell any investment product or invest in any company. This publication should not be construed as accounting, legal, regulatory, tax, financial or other advice. Investments in unit trusts are not obligations of, deposits in, or guaranteed or insured by United Overseas Bank Limited, UOBAM, or any of their subsidiary, associate or affiliate or their distributors. The Fund(s) may use or invest in financial derivative instruments, and you should be aware of the risks associated with investments in financial derivative instruments which are described in the Fund(s)’ prospectus.
Please visit the following for more details on the funds, important notes and the respective funds’ disclaimers.
United Asia Fund: https://www.uobam.com.sg/our-funds/highlights/united-asia-fund/index.page
United Greater China Fund: https://www.uobam.com.sg/our-funds/highlights/united-greater-china-fund/index.page
United ASEAN Fund: https://www.uobam.com.sg/our-funds/funds-details.page?mstarid=F0HKG062HL
This advertisement has not been reviewed by the Monetary Authority of Singapore.
UOB Asset Management Ltd Co. Reg. No. 198600120Z