

Positive Asian markets undaunted by tariff scares

Colin Ng
Head of Asia Equities

Paul Ho
Head of Investment Technology
Manager Comments
US-China tariff confusion
US-China trade tensions dominated headlines amid on-again, off-again policy announcements from the US.
Markets rallied mid-month following the announcement of a 90-day reprieve in US tariffs on China imports. But optimism soured later in the month after a series of fresh US restrictions were announced. This in turn was partially mitigated by a US Federal court ruling that the reciprocal tariffs were illegal.
Solid gains in May
Despite the uncertainties, Asia stocks rose almost everywhere in May with strong gains in technology-orientated boards and even those companies more exposed to trade.
- At the close of the month, the MSCI Asia Pacific ex Japan index had gained 4.03 percent, led by Taiwan's Taiex index. The market rose the most after substantial gains in its technology stocks including Apple supplier Hon Hai.
- South Korea's Kospi gained as political tensions eased ahead of the presidential election.
- The Hang Seng gained too but returns were volatile on trade news and economic data that leaned negative over the month.
- Mainland China A-share benchmarks were muted as investors continued to stay cautious.
- India's Nifty and Sensex boards inched higher but proved rangebound all month.
- Southeast Asia underperformed with Thailand's SET the sole Asia benchmark to fall over the month.
AI-Augmented Asia Solutions

United Asia Fund
May Performance: Fund gained 3.09 percent
| 1M | 1Y | 3Y | |
| United Asia Fund | 3.09% | -6.10% | 1.39% |
| Benchmark | 3.96% | 9.55% | 3.36% |
Source: Morningstar. Performance as of 31 May 2025, SGD basis, with dividends and distributions reinvested, if any. Fund refers to United Asia Fund – A SGD Acc. Benchmark: April 1992 – December 2011: MSCI AC FE ex-Japan; January 2012 to present: MSCI AC Asia ex-Japan. Performance figures for 1 month till 1 year show the per cent change, while performance figures above 1 year show the average annual compounded returns.
- The Fund was up 3.09 percent in the month of May, slightly underperforming its benchmark which rose 3.96 percent.
- The positive contributors to our performance last month were our China stock picks. Our portfolio holdings included several Chinese consumption companies which showed large growth numbers in their latest reports.
- Defying concerns about an economic slowdown in China, Popmart saw 186 percent net profit growth in 1Q25, Laopu Gold was up 254 percent in 2024, Mao Geping grew 33 percent in 2024, and Xiaomi saw 57 percent growth 1Q251.
- The Fund’s negative contribution came from our underweight postioning in Taiwan and Korea, and especially the Taiwan tech sector which continued to recover last month after April’s tariff scares. The Taiwan dollar also rose close to 6 percent against the SGD which further impacted our relative performance.
- We were also underweight Korea industrials, which have done well. Sectors such as shipbuilding rallied hard on Trump’s decision to levy an additional $140 on all Chinese registered/constructed ships that called on US ports. This caused many shipping companies to divert their new ship orders to Korean yards instead despite a 10-15 percent price premium.
- Similarly, Korean construction companies’ fortunes suddenly turned around after Trump’s surprise Executive Order to construct more nuclear plants in the US. Korean nuclear plant developers are expected to benefit as they have a good track record internationally.
Rebalancing: We are neutralising our country and sector positions
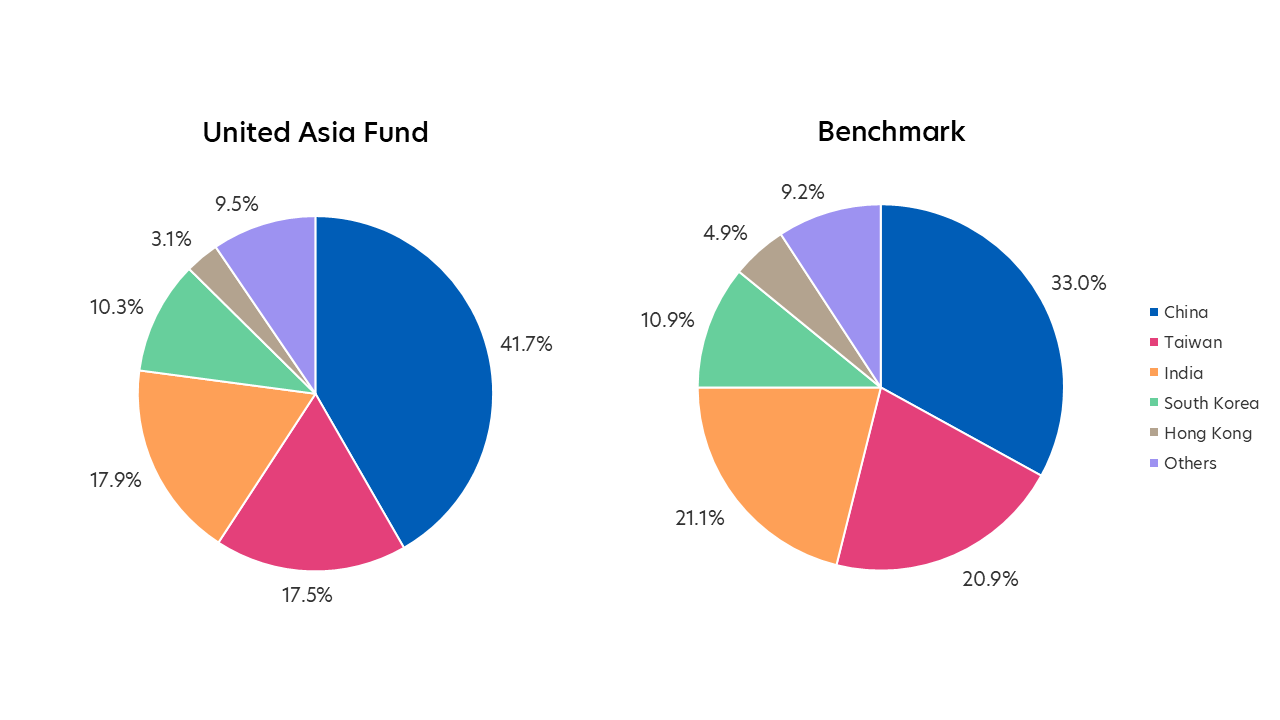
Source: Morningstar. Portfolio rebalancing as of 31 May 2025. Benchmark allocation as of 31 May 2025
- Given the uncertainties surrounding the final outcome of the US-China tariff negotiations and other possible new tariffs that might be imposed by the US, we feel that this is not the best time to take huge country or sector bets.
- With the exception of China where we were able to find good investment opportunities, we are keeping our country and sector bets within a 3 percent deviation from their benchmark weights.
- In particular, we have moved from an underweight to a neutral position on Korea, where we see a good chance of a meaningful turnaround in the performance of the market. We continue to actively look for more investments in that market.

United Greater China Fund
May Performance: Fund gained 4.36 percent
| 1M | 1Y | 3Y | |
| United Greater China Fund | 4.36% | -1.45% | 0.92% |
| Benchmark | 5.26% | 16.75% | 3.86% |
Source: Morningstar. Performance as of 31 May 2025, SGD basis, with dividends and distributions reinvested, if any. Fund refers to United Greater China Fund – A SGD Acc. Benchmark: MSCI Golden Dragon Index. Performance figures for 1 month till 1 year show the per cent change, while performance figures above 1 year show the average annual compounded returns.
- The Fund was up 4.36 percent in May, slightly underperforming the benchmark return of 5.26 percent.
- The positive contributors to our performance last month were our China stock picks. Our portfolio holdings included several Chinese consumption companies which showed large growth numbers in their latest reports.
- Defying concerns about an economic slowdown in China, Popmart saw 186 percent net profit growth in 1Q25, Laopu Gold was up 254 percent in 2024, Mao Geping grew 33 percent in 2024, and Xiaomi saw 57 percent growth 1Q252.
- The biggest detraction came from our underweight in Taiwan and in Taiwan tech specifically. Tech stocks had continued to recover last month. In addition, the Taiwan dollar rose close to 6 percent against the SGD, further impacting our relative performance.
Rebalancing: We have reduced our underweight in Taiwan tech
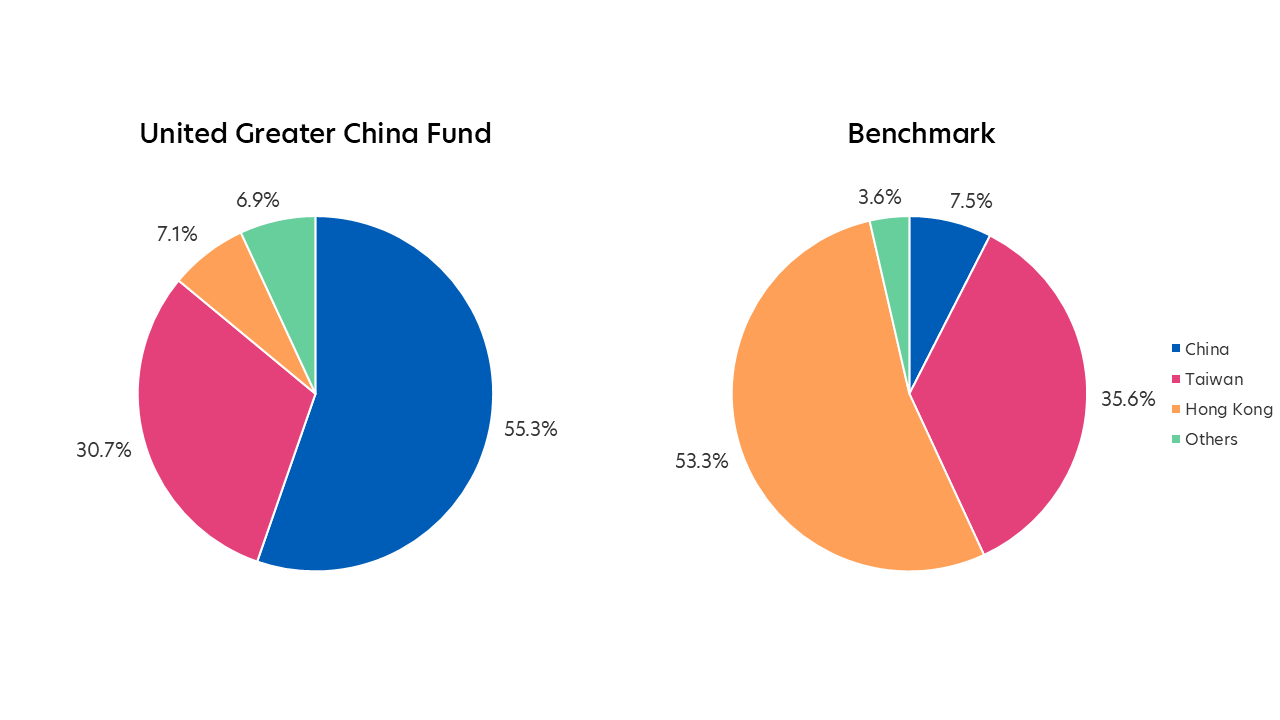
Source: Morningstar. Portfolio rebalancing as of 31 May 2025. Benchmark allocation as of 31 May 2025
- In line with our firm-wide strategy, we are taking a more neutral positioning relative to our benchmark, and see value in greater diversification amid current uncertainties.
Click here for more details on the Fund above.

United SG Dynamic Income Fund
May Performance: Fund beat its benchmark
| 1M | 1Y | 3Y | |
| United SG Dynamic Income Fund | 1.04% | 1.54% | - |
| Benchmark | 0.35% | 4.96% | - |
Source: Morningstar. Performance as of 31 May 2025, SGD basis, with dividends and distributions reinvested, if any. Fund refers to United SG Dynamic Income Fund – A SGD Acc. Benchmark: Singapore Overnight Rate Average (SORA) Index +2%. Performance figures for 1 month till 1 year show the per cent change, while performance figures above 1 year show the average annual compounded returns.
- The Fund was up 1.04 percent in the month of May, outperforming its SORA + 2 percent Benchmark which was up 0.35 percent.
- In May, our 30 percent allocation to SG Equities and Asia Equities proved beneficial, as these were the month’s best-performing asset classes. Our underweight position in SREITs - the worst performing among the Fund’s five asset classes - also helped our performance. Furthermore, our overweight position in SG Bonds outperformed the benchmark.
Rebalancing: We have increased our allocation to SREITs
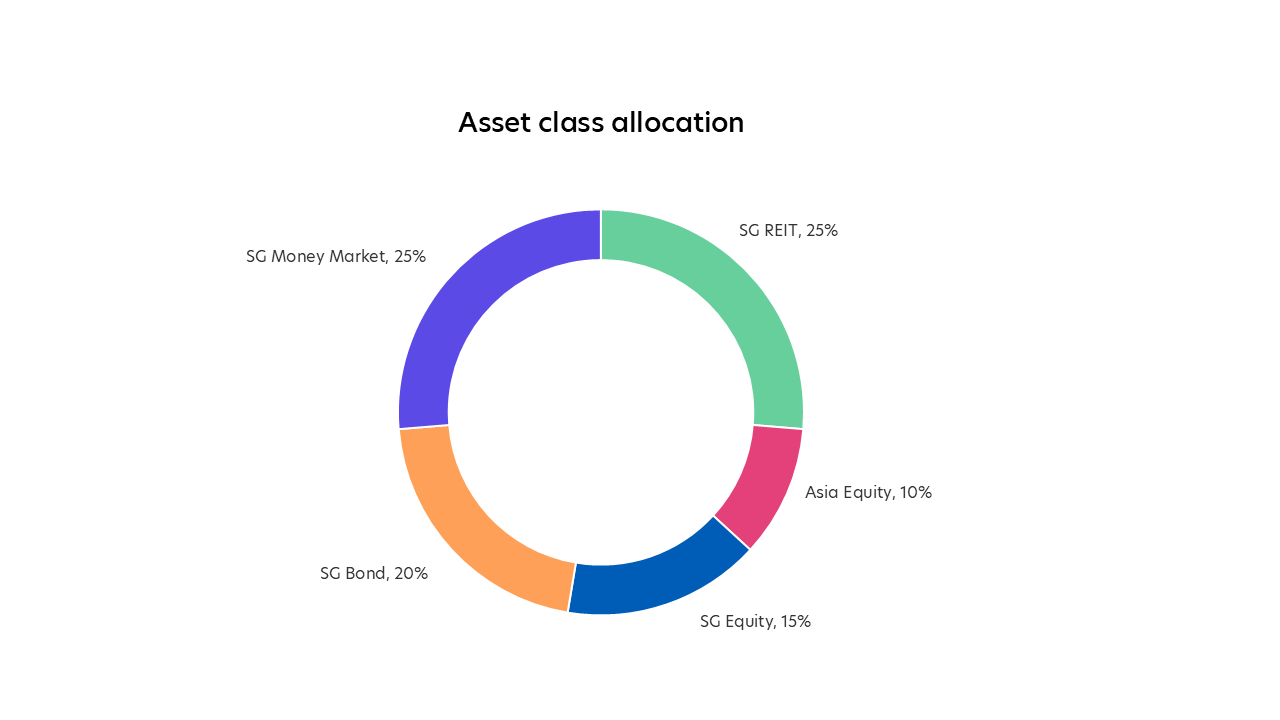
Source: UOBAM, as of 31 May 2025. Note: Cash allocation at 5%
- The AI model recommends switching out of Asia Equities, an asset class that did well last month. Instead, it recommends moving back to SREITs, the Fund’s worst performing asset class last month. The Strategy Committee concurs with this shift, and we are adding more weight to SREITs for June, partly funded from Asia Equities and also from SG Bonds.
Click here for more details on the Fund above.
| If you are interested in investment opportunities related to the theme covered in this article, here are some UOB Asset Management Funds to consider: United Asia Fund
United Greater China Fund
United SG Dynamic Income Fund
You may wish to seek advice from a financial adviser before making a commitment to invest in the above fund, and in the event that you choose not to do so, you should consider carefully whether the fund is suitable for you. |
MSCI Data are exclusive property of MSCI. MSCI Data are provided “as is”, MSCI bears no liability for or in connection with MSCI Data. MSCI full disclaimer here.
All information in this publication is based upon certain assumptions and analysis of information available as at the date of the publication and reflects prevailing conditions and UOB Asset Management Ltd (“UOBAM”)'s views as of such date, all of which are subject to change at any time without notice. Although care has been taken to ensure the accuracy of information contained in this publication, UOBAM makes no representation or warranty of any kind, express, implied or statutory, and shall not be responsible or liable for the accuracy or completeness of the information.
Potential investors should read the prospectus of the fund(s) (the “Fund(s)”) which is available and may be obtained from UOBAM or any of its appointed distributors, before deciding whether to subscribe for or purchase units in the Fund(s). Returns on the units are not guaranteed. The value of the units and the income from them, if any, may fall as well as rise, and is likely to have high volatility due to the investment policies and/or portfolio management techniques employed by the Fund(s). Please note that the graphs, charts, formulae or other devices set out or referred to in this document cannot, in and of itself, be used to determine and will not assist any person in deciding which investment product to buy or sell, or when to buy or sell an investment product. An investment in the Fund(s) is subject to investment risks and foreign exchange risks, including the possible loss of the principal amount invested. Investors should consider carefully the risks of investing in the Fund(s) and may wish to seek advice from a financial adviser before making a commitment to invest in the Fund(s). Should you choose not to seek advice from a financial adviser, you should consider carefully whether the Fund(s) is suitable for you. Investors should note that the past performance of any investment product, manager, company, entity or UOBAM mentioned in this publication, and any prediction, projection or forecast on the economy, stock market, bond market or the economic trends of the markets is not necessarily indicative of the future or likely performance of any investment product, manager, company, entity or UOBAM or the economy, stock market, bond market or economic trends of the markets. Nothing in this publication shall constitute a continuing representation or give rise to any implication that there has not been or that there will not be any change affecting the Funds. All subscription for the units in the Fund(s) must be made on the application forms accompanying the prospectus of that fund.
The above information is strictly for general information only and is not an offer, solicitation advice or recommendation to buy or sell any investment product or invest in any company. This publication should not be construed as accounting, legal, regulatory, tax, financial or other advice. Investments in unit trusts are not obligations of, deposits in, or guaranteed or insured by United Overseas Bank Limited, UOBAM, or any of their subsidiary, associate or affiliate or their distributors. The Fund(s) may use or invest in financial derivative instruments, and you should be aware of the risks associated with investments in financial derivative instruments which are described in the Fund(s)’ prospectus.
Please visit the following for more details on the funds, important notes and the respective funds’ disclaimers.
United Asia Fund: https://www.uobam.com.sg/our-funds/highlights/united-asia-fund/index.page
United Greater China Fund: https://www.uobam.com.sg/our-funds/highlights/united-greater-china-fund/index.page
United SG Dynamic Income Fund: https://www.uobam.com.sg/our-funds/highlights/united-sg-dynamic-income-fund/index.page
This advertisement has not been reviewed by the Monetary Authority of Singapore.
UOB Asset Management Ltd Co. Reg. No. 198600120Z