

UOBAM reduced portfolio risk in April amid US tariff uncertainties

Colin Ng
Head of Asia Equities

Paul Ho
Head of Investment Technology
Manager Comments
April marked by “Liberation Day”
In April, tariff uncertainty haunted investors. Stocks sold off sharply at the beginning of the month on the US tariff news which was much harsher than anyone had expected prior to 2 April – so-called Liberation Day.
China would eventually face a 145 percent tariff after President Trump increased its levy four times in a single week. He initially excluded pharmaceuticals and semiconductor imports but later said these would follow, adding that a probe into critical mineral imports would also take place. Importantly, we saw an equally robust response from China with the imposition of 125 percent tariffs and export bans on critical minerals.
Meanwhile, the impact on trade is slowly coming through but has yet to be fully felt as we begin to receive news and images of empty US ports, a phenomenon not seen even during Covid days. This is set to hurt both Chinese exporters and US consumers – but is yet to be reflected in macroeconomic data.
Stock selection partially offset risk-off positioning
As a result of the tariff uncertainties, China was the worst performing market in April (-7 precent in SGD terms) whilst India was one of the top performing markets (up 1.8 percent). The Strategy Committee debated these developments rigorously and decided to turn cautious. They advised all Funds to take a more defensive positioning and to raise cash levels.
This decision to raise cash initially helped our Asian funds’ performances at the start of the month, but contributed to our underperformance when markets rebounded towards the end of the month when signs emerged of a potential US-China trade deal.
However, our China stock selection remained a bright spot. Despite the China market’s significant sell down during the month, many of our stocks recorded significant positive returns.
AI-Augmented Asia Solutions

United Asia Fund
Performance: Underperformance of 2.66 percent in April
| 1M | 1Y | 3Y | |
| United Asia Fund | -4.80% | -10.16% | -0.93% |
| Benchmark | -2.14% | 6.07% | 1.94% |
Source: Morningstar. Performance as of 30 April 2025, SGD basis, with dividends and distributions reinvested, if any. Fund refers to United Asia Fund – A SGD Acc. Benchmark: April 1992 – December 2011: MSCI AC FE ex-Japan; January 2012 to present: MSCI AC Asia ex-Japan. Performance figures for 1 month till 1 year show the per cent change, while performance figures above 1 year show the average annual compounded returns. Past performance is not necessarily indicative of future performance
- The Fund returned -4.80 percent last month, lagging the benchmark which fell by -2.14 percent.
- The biggest detraction in performance came from our overweight in China and underweight in India, Taiwan and Korea. China was the worst performing market in April while India was one of the top performing markets.
- Our defensive stock picks also detracted from performance as markets rebounded in April after President Trump announced a 90-day tariff pause for most countries except for China.
Rebalancing: We have reduced our China overweight and increased our India allocation
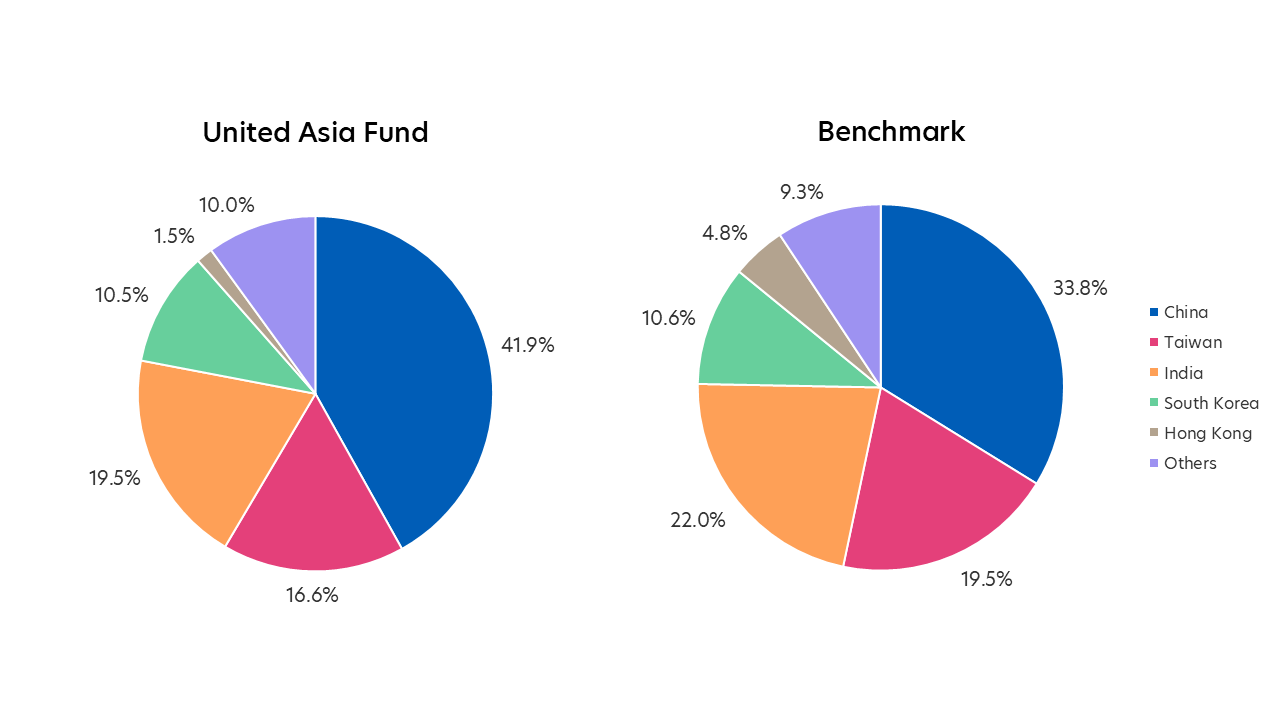
Source: Morningstar. Portfolio rebalancing as of 30 April 2025. Benchmark allocation as of 30 April 2025
- Since our last rebalancing, we have reduced our China exposure to 42 percent, a decrease from our previous overweight position. The benchmark allocation to China as of end-April is 34 percent.
- Given the outperformance of the India market, we have increased our India allocation and are now just 2.5 percent underweight relative to the benchmark.

United Greater China Fund
Performance: Underperformance of 2.02 percent in April
| 1M | 1Y | 3Y | |
| United Greater China Fund | -6.59% | -6.22% | -0.76% |
| Benchmark | -4.57% | 13.73% | 2.56% |
Source: Morningstar. Performance as of 30 April 2025, SGD basis, with dividends and distributions reinvested, if any. Fund refers to United Greater China Fund – A SGD Acc. Benchmark: MSCI Golden Dragon Index. Performance figures for 1 month till 1 year show the per cent change, while performance figures above 1 year show the average annual compounded returns. Past performance is not necessarily indicative of future performance.
- The Fund returned -6.59 percent last month, underperforming the benchmark which declined by -4.57 percent.
- Our underweight position in Taiwan and our defensive positioning of underweighting Taiwan tech stocks was the main detractor from performance.
- However, our recent China stock picks such as Pop Mart and Laopu recorded significant positive returns during the month of April despite the sell down in the broader China market, and contributed to portfolio returns during the month.
Rebalancing: We have reduced our China overweight, and increased our Taiwan allocation
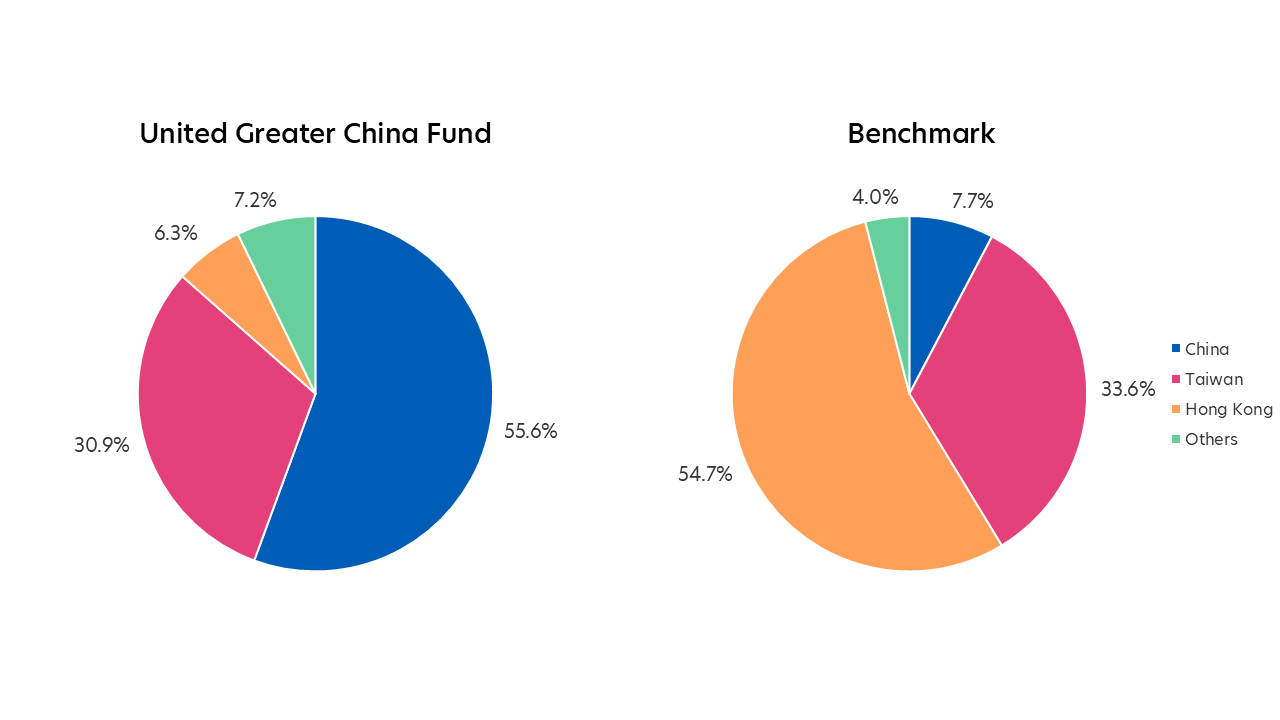
Source: Morningstar. Portfolio rebalancing as of 30 April 2025. Benchmark allocation as of 30 April 2025
- We have reduced our significant overweight in China and reduced our underweight to Taiwan.
- Sector-wise, we reduced our weights in Consumer Discretionary and Communication Services, bringing both to a neutral exposure. We added to Consumer Staples, thereby increasing our overweight position, to reflect our more cautious stance.

United SG Dynamic Income Fund
Performance: Underperformance of 1.90 percent in April
| 1M | 1Y | 3Y | |
| United SG Dynamic Income Fund | -1.55% | 0.70% | - |
| Benchmark | 0.35% | 5.10% | - |
Source: Morningstar. Performance as of 30 April 2025, SGD basis, with dividends and distributions reinvested, if any. Fund refers to United SG Dynamic Income Fund – A SGD Acc. Benchmark: Singapore Overnight Rate Average (SORA) Index +2%. Performance figures for 1 month till 1 year show the per cent change, while performance figures above 1 year show the average annual compounded returns. Past performance is not necessarily indicative of future performance.
- The Fund was down 1.55 percent in the month of April, underperforming the benchmark (SORA + 2 percent) which was up 0.35 percent.
- Our relatively high exposure to Equities (40 percent) detracted from performance as the asset class was meaningfully impacted by President Trump’s tariff announcements.
- The Strategy Committee portfolio and the Pure AI model portfolio performed broadly in line this month.
Rebalancing: We have increased our allocation to SG Money Market
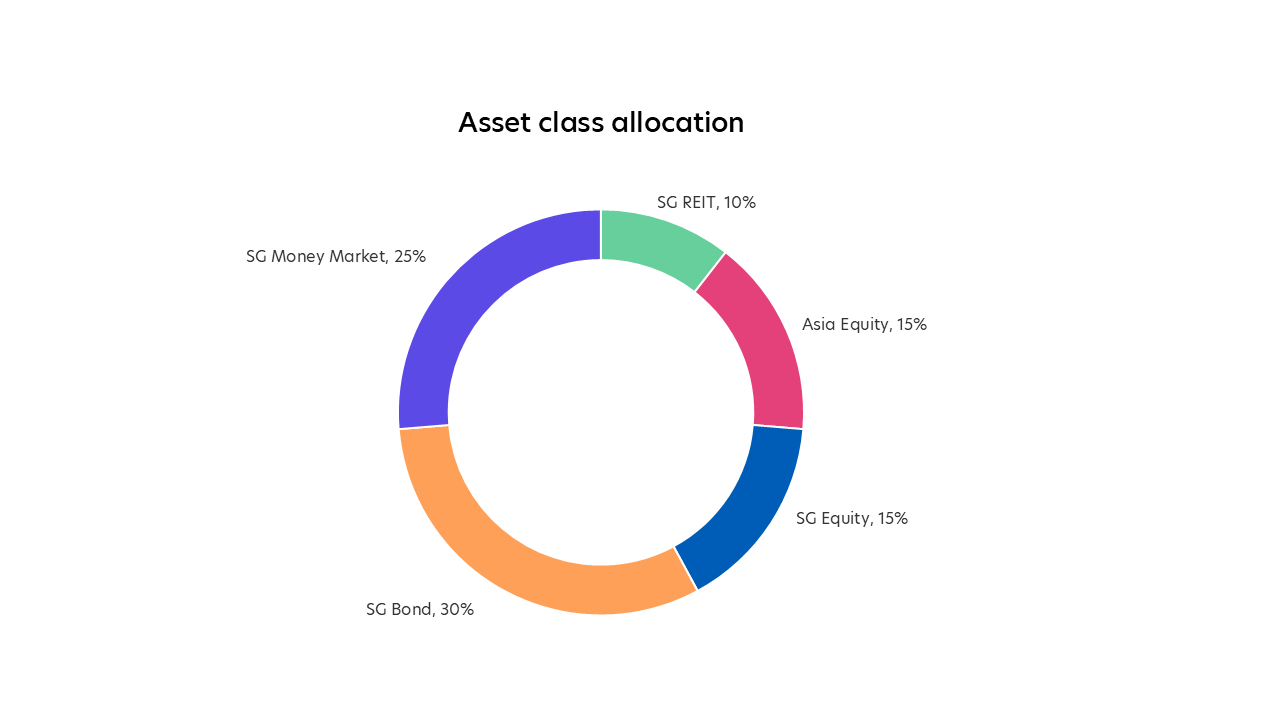
Source: UOBAM, as of 30 April 2025. Note: Cash allocation at 5%
- The AI model recommended reducing our allocation to SG Equity and increasing the allocation to SG Money Market.
- The Strategy Committee recommended maintaining a 10 percent allocation to SG REITs while concurring with the AI model to allocate more to SG Money Market.
For more details on the funds above, check out the respective Monthly Fund Commentaries.
| If you are interested in investment opportunities related to the theme covered in this article, here are some UOB Asset Management Funds to consider: United Asia Fund
United Greater China Fund
United SG Dynamic Income Fund
You may wish to seek advice from a financial adviser before making a commitment to invest in the above fund, and in the event that you choose not to do so, you should consider carefully whether the fund is suitable for you. |
MSCI Data are exclusive property of MSCI. MSCI Data are provided “as is”, MSCI bears no liability for or in connection with MSCI Data. MSCI full disclaimer here.
All information in this publication is based upon certain assumptions and analysis of information available as at the date of the publication and reflects prevailing conditions and UOB Asset Management Ltd (“UOBAM”)'s views as of such date, all of which are subject to change at any time without notice. Although care has been taken to ensure the accuracy of information contained in this publication, UOBAM makes no representation or warranty of any kind, express, implied or statutory, and shall not be responsible or liable for the accuracy or completeness of the information.
Potential investors should read the prospectus of the fund(s) (the “Fund(s)”) which is available and may be obtained from UOBAM or any of its appointed distributors, before deciding whether to subscribe for or purchase units in the Fund(s). Returns on the units are not guaranteed. The value of the units and the income from them, if any, may fall as well as rise, and is likely to have high volatility due to the investment policies and/or portfolio management techniques employed by the Fund(s). Please note that the graphs, charts, formulae or other devices set out or referred to in this document cannot, in and of itself, be used to determine and will not assist any person in deciding which investment product to buy or sell, or when to buy or sell an investment product. An investment in the Fund(s) is subject to investment risks and foreign exchange risks, including the possible loss of the principal amount invested. Investors should consider carefully the risks of investing in the Fund(s) and may wish to seek advice from a financial adviser before making a commitment to invest in the Fund(s). Should you choose not to seek advice from a financial adviser, you should consider carefully whether the Fund(s) is suitable for you. Investors should note that the past performance of any investment product, manager, company, entity or UOBAM mentioned in this publication, and any prediction, projection or forecast on the economy, stock market, bond market or the economic trends of the markets is not necessarily indicative of the future or likely performance of any investment product, manager, company, entity or UOBAM or the economy, stock market, bond market or economic trends of the markets. Nothing in this publication shall constitute a continuing representation or give rise to any implication that there has not been or that there will not be any change affecting the Funds. All subscription for the units in the Fund(s) must be made on the application forms accompanying the prospectus of that fund.
The above information is strictly for general information only and is not an offer, solicitation advice or recommendation to buy or sell any investment product or invest in any company. This publication should not be construed as accounting, legal, regulatory, tax, financial or other advice. Investments in unit trusts are not obligations of, deposits in, or guaranteed or insured by United Overseas Bank Limited, UOBAM, or any of their subsidiary, associate or affiliate or their distributors. The Fund(s) may use or invest in financial derivative instruments, and you should be aware of the risks associated with investments in financial derivative instruments which are described in the Fund(s)’ prospectus.
Please visit the following for more details on the funds, important notes and the respective funds’ disclaimers.
United Asia Fund: https://www.uobam.com.sg/our-funds/highlights/united-asia-fund/index.page
United Greater China Fund: https://www.uobam.com.sg/our-funds/highlights/united-greater-china-fund/index.page
United SG Dynamic Income Fund: https://www.uobam.com.sg/our-funds/highlights/united-sg-dynamic-income-fund/index.page
This advertisement has not been reviewed by the Monetary Authority of Singapore.
UOB Asset Management Ltd Co. Reg. No. 198600120Z