

Global equity markets reached record levels in the first quarter of 2024 as lingering recessionary fears fade away
In March this year, the Fed raised its 2024 growth forecast to 2.1 percent. Just three months before, many economists were still warning of a US recession. Quoting from Morningstar’s blog: how did all those PhDs get it so wrong?
One reason could be the highly polarised trends between the US’s services and manufacturing sectors. As UOBAM noted a year ago, travel, leisure, and entertainment companies appeared to be rebounding well from the Covid pandemic given high consumer demand and strong employment. Manufacturers, on the other hand, were unable to get back on their feet as they struggled to re-establish supply chains. We termed this a “rolling recession” and predicted a soft landing for the US and global economies.
Equity markets at new highs
As we had expected, US and global growth did not turn negative. Not surprisingly, by the end of 2023, even the most bearish economists were reassessing their GDP forecasts, causing a substantial shift in investor sentiment. Over the past three months, these newly-emboldened investors have helped to drive markets to new highs.
In the US, the S&P 500 has ended the first quarter with a 12.1 percent gain, and exceeded the 5,200 mark, a level unseen in its history.
Fig 1: S&P 500 (1984 – 2024)
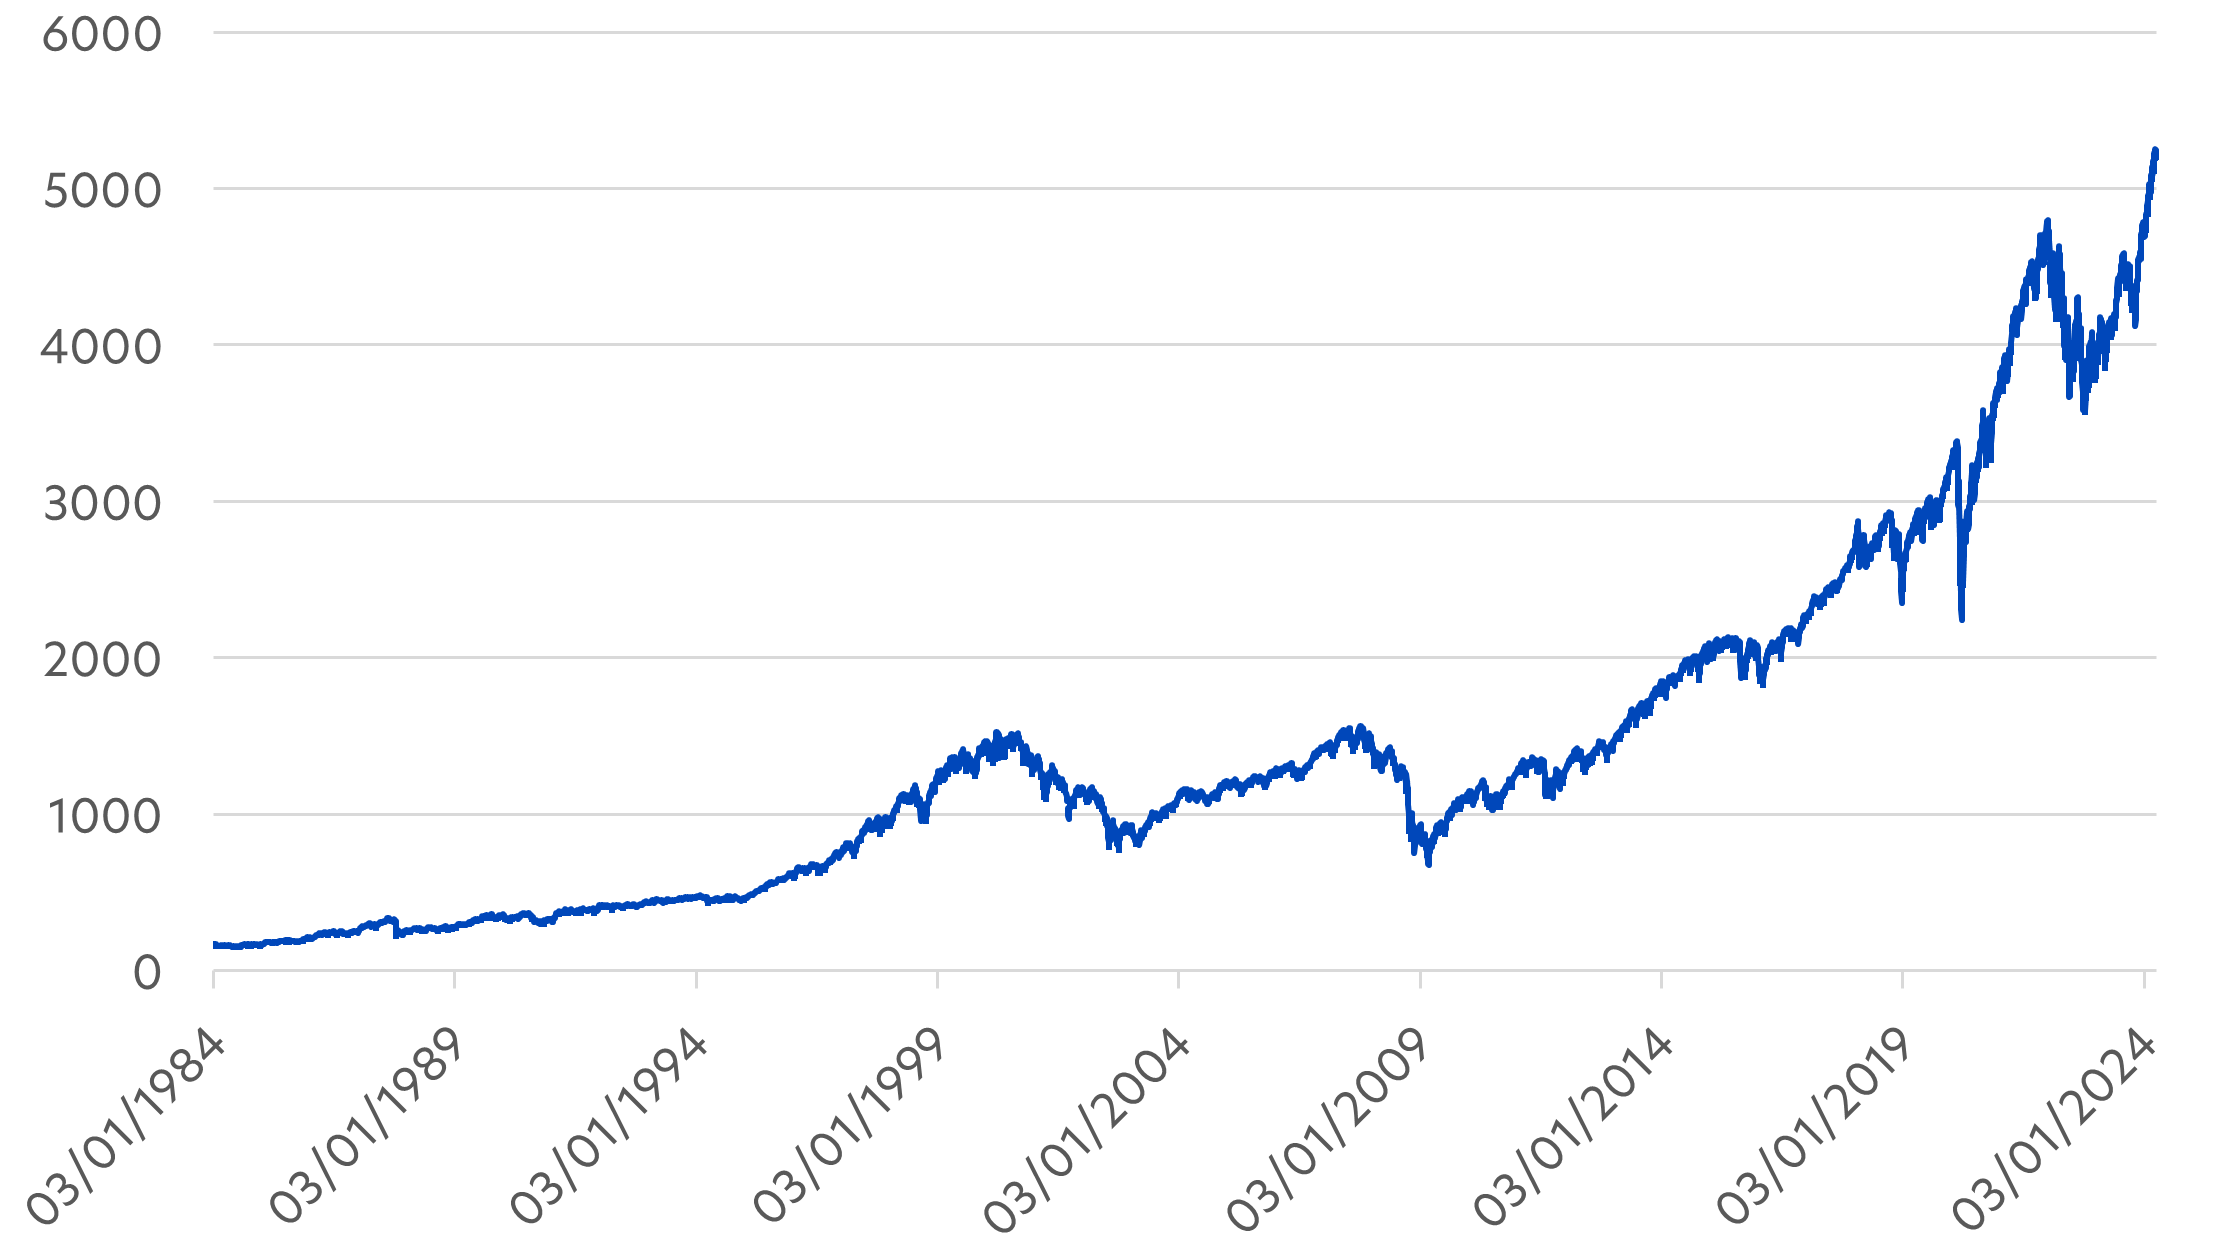
Source: Bloomberg/UOBAM
Nor is the better sentiment confined to the US. European and Japanese markets were also buoyant with both the EuroStoxx 600 and the Topix reaching levels not seen before. First quarter gains were 7.1 and 10.5 percent respectively. Only the MSCI AC Asia ex Japan index saw relatively modest gains of 3.9 percent, largely due to China-related headwinds. However, this masks the strong performance of individual Asian markets. Taiwan’s TAIEX index for example rose by 9.5 percent over the quarter.
Data supports the recovery story
Recent data on US manufacturing suggests that this sector – the last major source of economic worry – has finally turned the corner. The US Manufacturing PMI (Purchasing Managers Index) registered 50.3 percent for March, the first time the index has registered a reading above 50 for 16 consecutive months. It indicates that, after an extended period of contraction, economic activity amongst manufacturers has once again turned positive.
Fig 2: Manufacturing PMI, Jan 2022 – March 2024
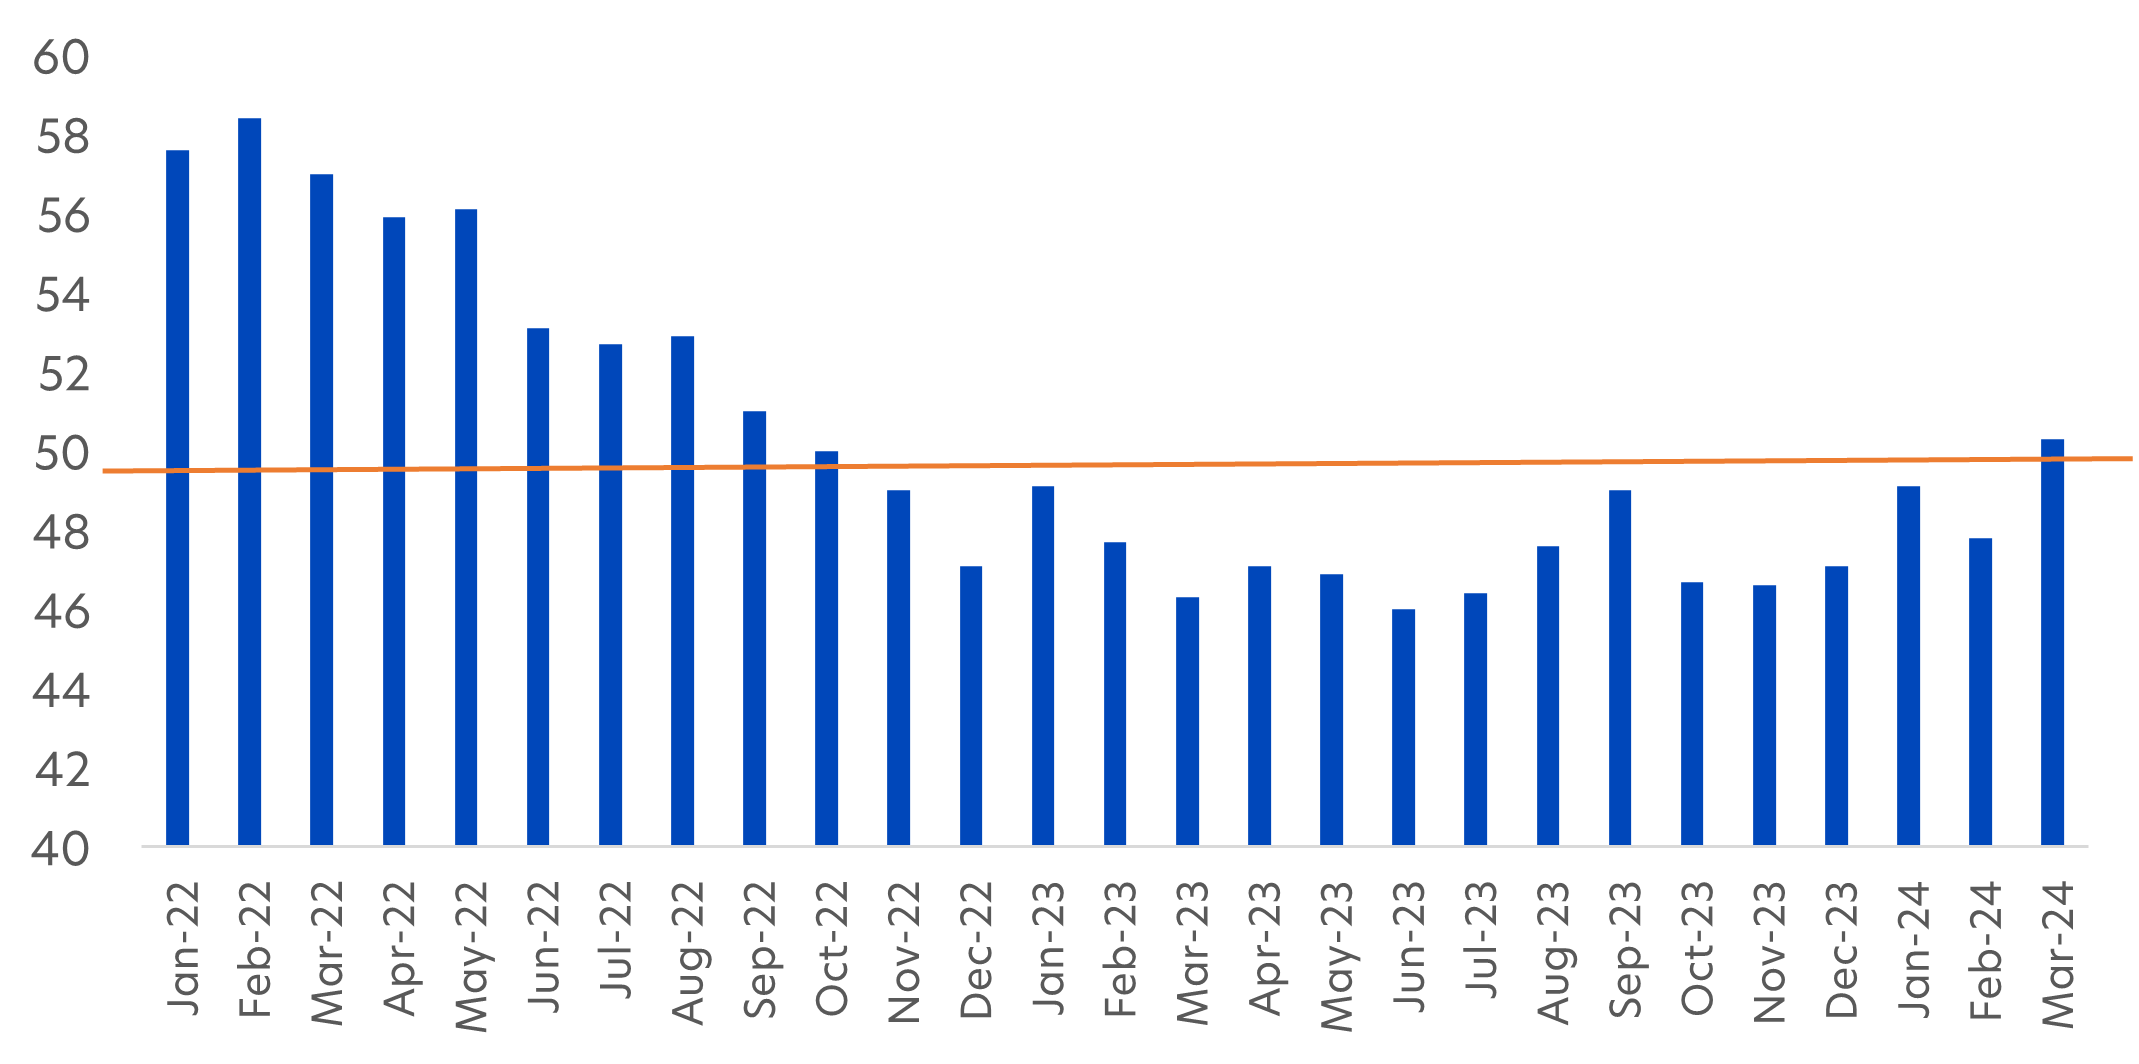
Source: Trading Economics/ UOBAM
Underpinning this recovery is a rebound in new orders and increased factory output. However, the picture is not yet consistent across the whole sector. Industries such as textile mills, paper products, primary metals, chemical products and transportation equipment saw growth last month. On the other hand, manufacturers of electrical appliances, electronic products, machinery and computers continued to report a contraction, suggesting that the recovery still has some way to go.
Stronger for longer
Nevertheless, as we have been saying since the start of the year, we believe the hard part is over and it is difficult to see what could trip up global markets going forward. Inflation appears to be under control and recession risks have faded. Furthermore, despite the market rallies, there is still a record US$6 trillion of cash sitting in money market funds and yet to be deployed in equity and credit markets.
In fact, there are good reasons to think that investors are underestimating the upside potential of markets over the next few years. The AI, biotech and other technology themes driving economic growth in the US, China, Europe and Asia are reminiscent of the 1990s dotcom boom.
Fig 3: S&P500 returns, 2020s vs 1990s
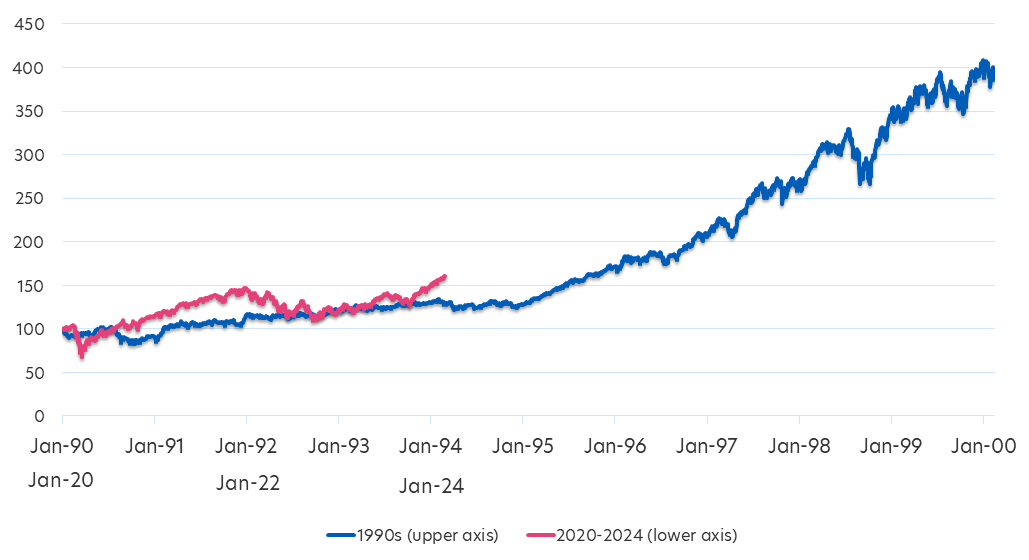
Source: Bloomberg, 1990s data from Jan 1990 to Jan 2000, 2020s data from Jan 2020 to Mar 2024
Similar to the 90s, innovation in these areas, and the associated productivity gains, are evolving at a breakneck speed. If indeed these themes become as exciting and dominant as during the 90s, then we can expect the market to show similar multi-year advances. To benefit fully, we think investors will need to move away from their investing mindsets of the past decade and be ready for a new decade of transformative investment opportunities.
| If you are interested in investment opportunities related to the theme covered in this article, here are some UOB Asset Management Funds to consider: United Global Quality Growth Fund United Global Durable Equities Fund United Global Innovation Fund You may wish to seek advice from a financial adviser before making a commitment to invest in the above fund, and in the event that you choose not to do so, you should consider carefully whether the fund is suitable for you. |
MSCI Data are exclusive property of MSCI. MSCI Data are provided “as is”, MSCI bears no liability for or in connection with MSCI Data. MSCI full disclaimer here.
This publication shall not be copied or disseminated, or relied upon by any person for whatever purpose. The information herein is given on a general basis without obligation and is strictly for information only. This publication is not an offer, solicitation, recommendation or advice to buy or sell any investment product, including any collective investment schemes or shares of companies mentioned within. Although every reasonable care has been taken to ensure the accuracy and objectivity of the information contained in this publication, UOB Asset Management Ltd (“UOBAM”) and its employees shall not be held liable for any error, inaccuracy and/or omission, howsoever caused, or for any decision or action taken based on views expressed or information in this publication. The information contained in this publication, including any data, projections and underlying assumptions are based upon certain assumptions, management forecasts and analysis of information available and reflects prevailing conditions and our views as of the date of this publication, all of which are subject to change at any time without notice. Please note that the graphs, charts, formulae or other devices set out or referred to in this document cannot, in and of itself, be used to determine and will not assist any person in deciding which investment product to buy or sell, or when to buy or sell an investment product. UOBAM does not warrant the accuracy, adequacy, timeliness or completeness of the information herein for any particular purpose, and expressly disclaims liability for any error, inaccuracy or omission. Any opinion, projection and other forward-looking statement regarding future events or performance of, including but not limited to, countries, markets or companies is not necessarily indicative of, and may differ from actual events or results. Nothing in this publication constitutes accounting, legal, regulatory, tax or other advice. The information herein has no regard to the specific objectives, financial situation and particular needs of any specific person.You may wish to seek advice from a professional or an independent financial adviser about the issues discussed herein or before investing in any investment or insurance product. Should you choose not to seek such advice, you should consider carefully whether the investment or insurance product in question is suitable for you.
This advertisement has not been reviewed by the Monetary Authority of Singapore.
UOB Asset Management Ltd. Company Reg. No. 198600120Z