

- India’s three-year equity performance far outstrips any other Asian market
- The country is also expected to see the strongest growth in Asia this year
- However, elevated valuations point to the need for some caution in 2024
The world’s fifth largest market
The Indian stock market has long operated in the shadows of its Chinese counterpart, but with a market capitalisation that has just crossed the US$4 trillion mark, global investors are suddenly sitting up and paying attention.
India’s market cap has grown by 60 percent over the past three years, and is now larger than every European stock market. Its size is currently only surpassed by the US, China, Japan and Hong Kong.
When adjusted for free floats and excluding small caps, as in the case of the MSCI AC Asia ex Japan index, India becomes even more important. It now occupies 20 percent of the index compared to 12 percent in Jan 2021, making it the second-largest component. Over the same time frame, China’s share of the index has fallen to 30 percent from 48 percent previously.
India up, China down
This market cap growth has been made possible by India’s consistently strong stock market performance over the past three years. As a result, India’s 2020 to 2023 performance is outstanding, beating the second-best performer, Taiwan, by more than double. China on the other hand was the region’s biggest underperformer.
Fig 1: Select Asian stock market performance over 1 and 3 years (%)
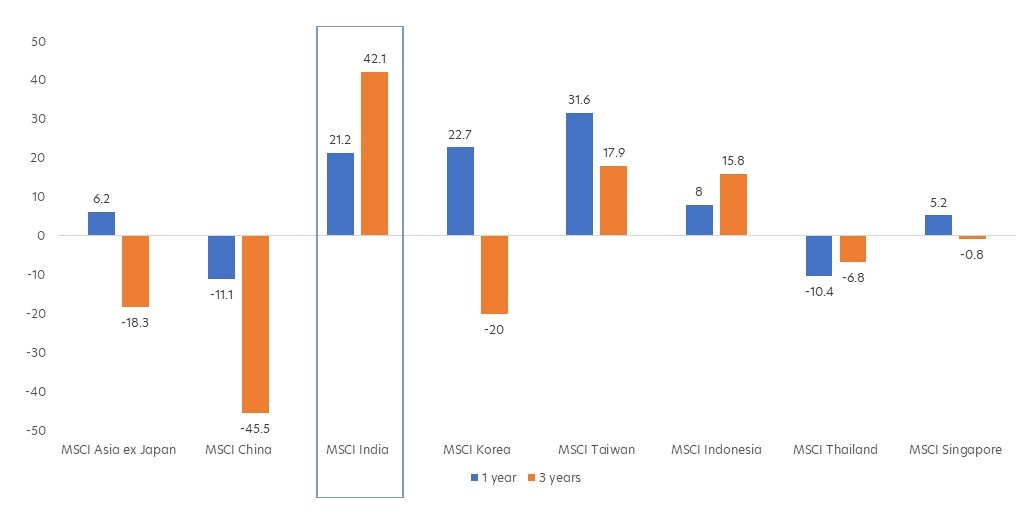
Source: Bloomberg/ UOBAM, Dec 2023
India’s stock performance is powered by good corporate profitability. Corporate profits as a share of GDP is now close to 5 percent, bolstered by strong earnings growth. According to Morgan Stanley analysts1, Indian corporates are experiencing a profit upcycle that could bring this share to 8 percent in the next three to four years.
Growing by leaps and bounds
India is today the world’s fifth largest economy and this year, is also expected to be one of the fastest-growing. The Asian Development Bank’s (ADB) latest forecast for 2024 puts India’s growth at 6.7 percent, a good distance ahead of all other Asian markets.
Asia’s largest economy, China, announced last week that its GDP grew by 5.2 percent in 2023, but the ADB expects this to fall to 4.5 percent in 2024, amid a number of growth challenges, including falling exports.
On the other hand, India’s GDP is expected to stay above 6.0 percent over the next few years, driven primarily by strong private consumption. Unlike in China where the savings rate is still high, positive sentiment in India is encouraging credit-fueled spending, with household debt now at a 15-year high.
India is also enjoying robust industrial and services activity, and the latest leading indicators are very encouraging. Both the Manufacturing PMI (Purchasing Managers Index), currently at 54.9 and the Services PMI at 59.0 are well above the 50 threshold.
Several risks ahead
Despite this rosy picture, we would sound a note of caution. While we continue to benefit from our India holdings, we believe that the market’s overall PER (price earnings ratio) at around 20 times, is over-extended relative to historical levels.
Also, we think the India market’s EPS (earnings per share) growth projections do not justify such high prices, especially when compared to other markets in Asia. China and Taiwan’s 2025 EPS growth is forecast to be similar to, or higher than, India’s, yet their PERs are far lower.
Figure 2: Valuation forecasts by market, 2024 – 2025
| Market | PER (x) | EPS Growth YoY (%) | Dividend Yield (%) | ||
| 2024E | 2025E | 2024E | 2025E | 2024E | |
| India | 21.9 | 19.1 | 17.3 | 14.4 | 1.4 |
| China | 8.9 | 7.8 | 14.1 | 15.0 | 2.8 |
| Taiwan | 15.7 | 13.1 | 16.7 | 20.4 | 3.1 |
| Korea | 10.9 | 8.8 | 64.9 | 23.5 | 2.2 |
| Singapore | 11.4 | 10.9 | 3.5 | 4.6 | 5.0 |
| Indonesia | 13.7 | 12.9 | 8.9 | 6.5 | 4.2 |
| Thailand | 16.6 | 14.6 | 12.5 | 13.4 | 3.1 |
Source: UOBAM/ FACTSET/ FACTSET MKT AGGREGATES, 9 Jan 2024
Market valuations aside, any risks to India’s consumption demand could cause its strong growth to falter. Of immediate concern is inflation, and in particular food inflation. In December 2023, food prices increased by 9.5 percent year-over-year and the situation could worsen if poor weather conditions continue to affect grain production. High food prices would steer demand away from other sectors.
Similarly, Indian officials are worried that an escalation of hostilities in the Middle East could cause a spike in oil prices. As an oil-importer, India is vulnerable to oil price rises, and experts say an increase of US$10 to US$20 could start to negatively impact India’s economy and add to inflationary pressures.
Over the longer term, it is worth noting that the average per capita income is currently just US$2,500 per annum, less than a quarter of China’s. Failure to address current poverty levels and wealth disparities could end up limiting the country’s consumption growth trajectory. On the other hand, such low levels suggest plenty of room for improvement.
Be selective
UOBAM is optimistic about India’s economic momentum. The country’s financial markets are also set to see significant fund flows as investors continue to shun China equities.
However, we remain on the lookout for positive earnings revisions. In the absence of such revisions, we would consider the market to be extremely rich and would not be surprised by some market correction in the next few quarters.
We would therefore recommend a selective approach to Indian equities, with a focus on stocks that have a high potential for their valuations to be re-rated positively.
1Source: India's Earnings Outlook Positive For FY24, Says Morgan Stanley's Ridham Desai, NDTV, 11 Nov 2023
If you are interested in investment opportunities related to the theme covered in this article, here is a UOB Asset Management Fund to consider:
|
This publication shall not be copied or disseminated, or relied upon by any person for whatever purpose. The information herein is given on a general basis without obligation and is strictly for information only. This publication is not an offer, solicitation, recommendation or advice to buy or sell any investment product, including any collective investment schemes or shares of companies mentioned within. Although every reasonable care has been taken to ensure the accuracy and objectivity of the information contained in this publication, UOB Asset Management Ltd (“UOBAM”) and its employees shall not be held liable for any error, inaccuracy and/or omission, howsoever caused, or for any decision or action taken based on views expressed or information in this publication. The information contained in this publication, including any data, projections and underlying assumptions are based upon certain assumptions, management forecasts and analysis of information available and reflects prevailing conditions and our views as of the date of this publication, all of which are subject to change at any time without notice. Please note that the graphs, charts, formulae or other devices set out or referred to in this document cannot, in and of itself, be used to determine and will not assist any person in deciding which investment product to buy or sell, or when to buy or sell an investment product. UOBAM does not warrant the accuracy, adequacy, timeliness or completeness of the information herein for any particular purpose, and expressly disclaims liability for any error, inaccuracy or omission. Any opinion, projection and other forward-looking statement regarding future events or performance of, including but not limited to, countries, markets or companies is not necessarily indicative of, and may differ from actual events or results. Nothing in this publication constitutes accounting, legal, regulatory, tax or other advice. The information herein has no regard to the specific objectives, financial situation and particular needs of any specific person. You may wish to seek advice from a professional or an independent financial adviser about the issues discussed herein or before investing in any investment or insurance product. Should you choose not to seek such advice, you should consider carefully whether the investment or insurance product in question is suitable for you.
This advertisement has not been reviewed by the Monetary Authority of Singapore.
UOB Asset Management Ltd. Company Reg. No. 198600120Z