

Asian equities took a breather in November after a strong run

Paul Ho
Group Head of Asia ex Japan Equities
Manager Comments
Asian equity markets (MSCI Asia ex Japan Index, SGD terms) fell 3.3 percent in November, marking the first monthly decline after seven consecutive gains. The pullback was driven by concerns over technology valuations and weaker economic data, with South Korea, Taiwan, and China contributing most to the downside.
South Korea: Volatility amid tech valuation concerns
South Korea’s market started the month on a positive note after authorities announced plans to lower income tax thresholds on dividends, a move seen as supportive for equity investors. However, optimism quickly faded when the Korea Exchange issued a rare “investment caution” warning on SK Hynix, citing stretched valuations. This triggered a sharp sell-off in technology stocks, which spilled over into broader markets.
Taiwan: Tech spillover dampened gains
Taiwan equities mirrored Korea’s trajectory, with weakness concentrated in technology names. Concerns over lofty valuations in the semiconductor space weighed on investor sentiment, overshadowing otherwise resilient export trends.
China: Disappointing economic data
Chinese equities were weighed down by a slew of disappointing economic data releases which showed slowing growth. Industrial production and retail sales in October grew at their weakest pace in 15 months, while fixed asset investment contracted further. Property sector stress deepened as new home prices fell at their steepest monthly pace in a year. External demand also softened, with exports unexpectedly contracting in October.
On the consumer front, Singles’ Day sales underwhelmed, monthly car sales fell for the first time in over a year, and credit and new loans fell short of estimates as both business and consumer confidence remained subdued. Inflation trends were mixed with producer price deflation moderating but consumer prices and core inflation rising on holiday spending. Industrial profits also declined, reversing two months of gains.
ASEAN: Defensive resilience
In contrast, ASEAN markets proved more resilient. Indonesia’s benchmark reached record highs, while Singapore, Malaysia, and the Philippines also posted advances, with the latter breaking a six-month losing streak.
AI-Augmented Asia Solutions

United Asia Fund
- Below benchmark: In November 2025, the Fund declined 3.77 percent, underperforming the benchmark by 0.46 percent.
| 1M | 1Y | 3Y | |
| United Asia Fund | -3.77% | 15.63% | 10.89% |
| Benchmark | -3.31% | 24.57% | 12.96% |
Source: Morningstar. Performance as of 30 November 2025, SGD basis, with dividends and distributions reinvested, if any. Fund refers to United Asia Fund – A SGD Acc. Benchmark: April 1992 – December 2011: MSCI AC FE ex-Japan; January 2012 to present: MSCI AC Asia ex-Japan. Performance figures for 1 month till 1 year show the per cent change, while performance figures above 1 year show the average annual compounded returns.
- Detraction due to China and tech underperformance: The Fund was weighed down by weakness in China and the tech sector, both of which had delivered strong gains in prior months. However, we view this as a healthy correction and remain confident in the medium-term outlook. Rising AI-related capex should begin to reflect in corporate earnings, supporting tech valuations. For China, we maintain a selective approach, focusing on innovation-driven sectors rather than traditional areas such as real estate and exports, which continue to face headwinds. Foreign positioning in China remains light, and we believe greater participation could unlock upside as fundamentals and valuations improve.
- Strong returns from Taiwan tech: Our exposure to this sector contributed positively in November with gains largely led by a DRAM stock that we have an off-benchmark allocation to. That stock defied the profit taking we have seen in the rest of the tech sector. DRAM prices have surged more than six-fold in the past quarter, driven by AI-related demand, while supply constraints are expected to persist until 2027 and beyond, reinforcing our conviction in this position.
- Shift to HK financials: Our AI engine has turned short-term cautious on China, recommending profit-taking in select China and Taiwan positions, and reallocating to Hong Kong financials. In line with the AI engine output, we have increased our exposure to Hong Kong financial stocks, which remain undervalued at 0.3x–0.4x price-to-book and offer 5–7 percent dividend yields. These stocks have been sold down in recent years due to property sector concerns, but signs of a property market bottom and further US rate cuts could provide tailwinds.
- Increasing exposure to Utilities: Our AI engine also sees good potential in utility stocks both in China and India. Whilst utilities are traditionally viewed as a defensive but low growth sector, our analysts think there is higher growth potential for this sector as the rapid growth in AI data centre results in greater power demand over the coming years.
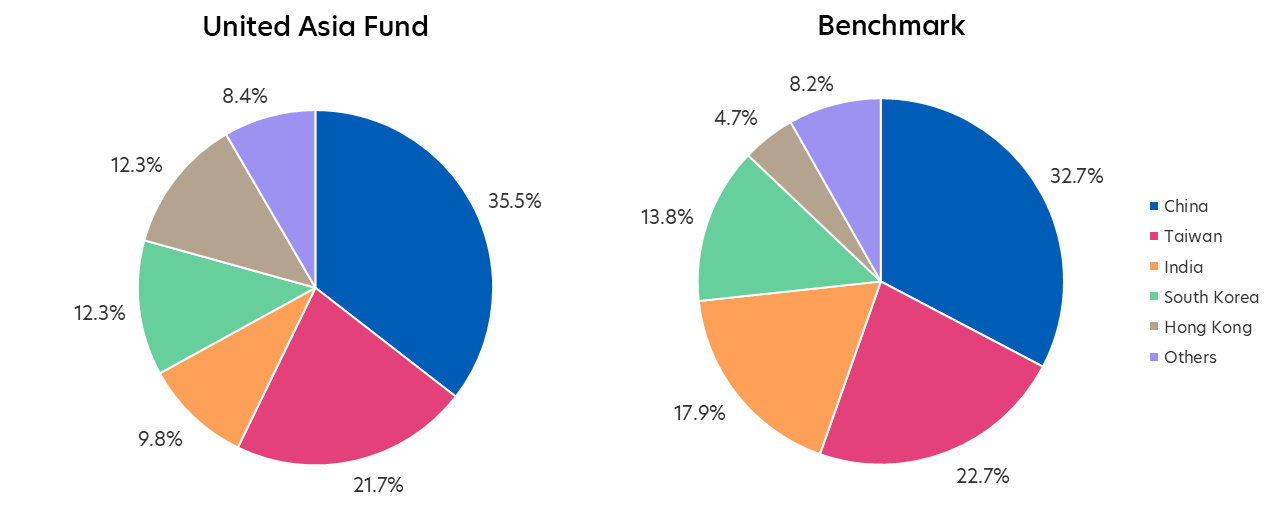
Source: Morningstar. Portfolio rebalancing as of 30 November 2025. Benchmark allocation as of 30 November 2025
Click here for more details on the Fund above.

United Greater China Fund
- Returns in line with benchmark: The Fund dipped 3.52 percent in November 2025, close to the benchmark’s return of -3.55 percent.
| 1M | 1Y | 3Y | |
| United Greater China Fund | -3.52% | 32.12% | 13.67% |
| Benchmark | -3.55% | 31.84% | 15.94% |
Source: Morningstar. Performance as of 30 November 2025, SGD basis, with dividends and distributions reinvested, if any. Fund refers to United Greater China Fund – A SGD Acc. Benchmark: MSCI Golden Dragon Index. Performance figures for 1 month till 1 year show the per cent change, while performance figures above 1 year show the average annual compounded returns.
- Pullback in China tech stocks: Similar to the United Asia Fund, the Fund was impacted by a correction in China equities, particularly in tech-related names, following a series of disappointing macroeconomic data releases.
- Taiwan tech compensated: Our Taiwan tech holdings delivered gains that helped offset some of the weakness from China and Hong Kong. In line with our AI-driven recommendations, we have reduced exposure to China and Taiwan and reallocated to Hong Kong, with a focus on financials and other select sectors.
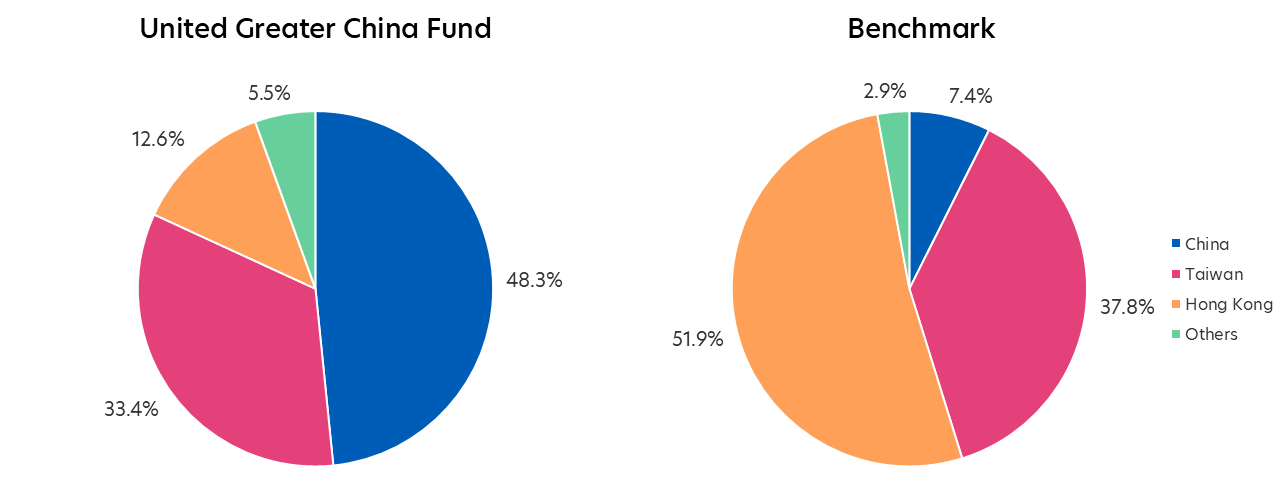
Source: Morningstar. Portfolio rebalancing as of 30 November 2025. Benchmark allocation as of 30 November 2025. Note: Differences in country allocation between the Fund and Benchmark may arise from differing country classification methodologies which define Hong Kong-listed Chinese companies differently.
Click here for more details on the Fund above.

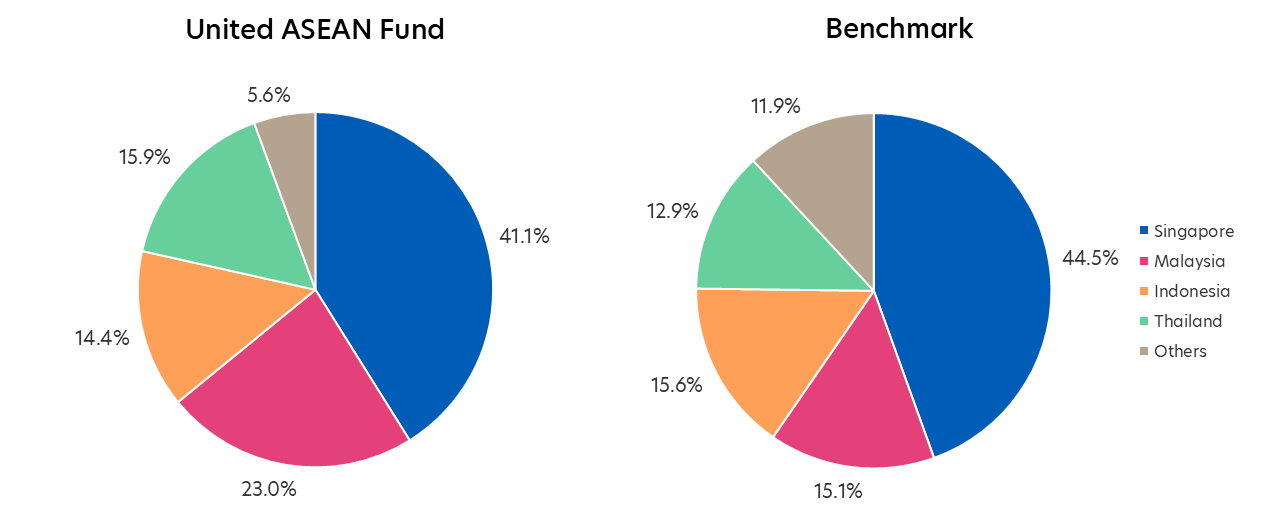
United ASEAN Fund
- Below benchmark: In November, the Fund returned -2.45 percent, underperforming the benchmark by 2.18 percent.
| 1M | 1Y | 3Y | |
| United ASEAN Fund | -2.45% | 6.77% | 5.45% |
| Benchmark | -0.28% | 9.33% | 6.65% |
Source: Morningstar. Performance as of 30 November 2025, SGD basis, with dividends and distributions reinvested, if any. Fund refers to United ASEAN Fund – A SGD Acc. Benchmark: Jun 86 - Jan 93: 100% DBS 50; Feb 93 - Aug 98: 50% DBS 50, 50% KLEMAS; Sep 98 - May 00: 100% DBS 50; June 00 - May 06: 50% STI Index, 50% KLEMAS; June 06 - June 13: 50% STI Index, 50% KLCI; Jul 13 - present: MSCI ASEAN. Performance figures for 1 month till 1 year show the per cent change, while performance figures above 1 year show the average annual compounded returns.
- Security selection detracted: The Fund’s underperformance last month was due largely to security selection. Key detractors included OCBC, Trimegah Bangun Persada, and PTTGC while United Plantations, First Resources, and Indosat contributed positively.
- Increased exposure to Thailand: We have added positions in utility and tourism-related companies, guided by shortlists generated by our AI engine. These sectors are well-positioned to benefit from structural growth drivers and improving domestic demand.
- Resilient domestic consumption: We continue to maintain a constructive view on the consumer sector and select commodity names, supported by a growing middle class, ongoing government stimulus measures, and attractive valuations.
Source: Morningstar. Portfolio rebalancing as of 30 November 2025. Benchmark allocation as of 30 November 2025
Click here for more details on the Fund above.
MSCI Data are exclusive property of MSCI. MSCI Data are provided “as is”, MSCI bears no liability for or in connection with MSCI Data. MSCI full disclaimer here.
All information in this publication is based upon certain assumptions and analysis of information available as at the date of the publication and reflects prevailing conditions and UOB Asset Management Ltd (“UOBAM”)'s views as of such date, all of which are subject to change at any time without notice. Although care has been taken to ensure the accuracy of information contained in this publication, UOBAM makes no representation or warranty of any kind, express, implied or statutory, and shall not be responsible or liable for the accuracy or completeness of the information.
Potential investors should read the prospectus of the fund(s) (the “Fund(s)”) which is available and may be obtained from UOBAM or any of its appointed distributors, before deciding whether to subscribe for or purchase units in the Fund(s). Returns on the units are not guaranteed. The value of the units and the income from them, if any, may fall as well as rise, and is likely to have high volatility due to the investment policies and/or portfolio management techniques employed by the Fund(s). Please note that the graphs, charts, formulae or other devices set out or referred to in this document cannot, in and of itself, be used to determine and will not assist any person in deciding which investment product to buy or sell, or when to buy or sell an investment product. An investment in the Fund(s) is subject to investment risks and foreign exchange risks, including the possible loss of the principal amount invested. Investors should consider carefully the risks of investing in the Fund(s) and may wish to seek advice from a financial adviser before making a commitment to invest in the Fund(s). Should you choose not to seek advice from a financial adviser, you should consider carefully whether the Fund(s) is suitable for you. Investors should note that the past performance of any investment product, manager, company, entity or UOBAM mentioned in this publication, and any prediction, projection or forecast on the economy, stock market, bond market or the economic trends of the markets is not necessarily indicative of the future or likely performance of any investment product, manager, company, entity or UOBAM or the economy, stock market, bond market or economic trends of the markets. Nothing in this publication shall constitute a continuing representation or give rise to any implication that there has not been or that there will not be any change affecting the Funds. All subscription for the units in the Fund(s) must be made on the application forms accompanying the prospectus of that fund.
The above information is strictly for general information only and is not an offer, solicitation advice or recommendation to buy or sell any investment product or invest in any company. This publication should not be construed as accounting, legal, regulatory, tax, financial or other advice. Investments in unit trusts are not obligations of, deposits in, or guaranteed or insured by United Overseas Bank Limited, UOBAM, or any of their subsidiary, associate or affiliate or their distributors. The Fund(s) may use or invest in financial derivative instruments, and you should be aware of the risks associated with investments in financial derivative instruments which are described in the Fund(s)’ prospectus.
Please visit the following for more details on the funds, important notes and the respective funds’ disclaimers.
United Asia Fund: https://www.uobam.com.sg/our-funds/highlights/united-asia-fund/index.page
United Greater China Fund: https://www.uobam.com.sg/our-funds/highlights/united-greater-china-fund/index.page
United ASEAN Fund: https://www.uobam.com.sg/our-funds/funds-details.page?mstarid=F0HKG062HL
This advertisement has not been reviewed by the Monetary Authority of Singapore.
UOB Asset Management Ltd Co. Reg. No. 198600120Z