

North-south divide in Asia’s performance

Paul Ho
Group Head of Asia ex Japan Equities
Manager Comments
Asia ex-Japan equity markets delivered strong performances in September. The region overall is up by 7.35 percent in SGD terms but we see divergent regional dynamics, shaped by investor sentiment.
North Asia continued to shine
China stocks achieved their fifth consecutive month of gains, marking their best monthly run since 2018, with the MSCI China Index advancing nearly 9 percent. Chinese markets appear to be slowly shedding their "uninvestable" tag as global hedge funds return to onshore China equities. The improved sentiment appears to be driven by progress on AI models made by Chinese internet giants by leveraging on locally-developed semiconductors.
Other north Asian markets also gained last month driven by AI themes, outperforming their south Asian peers. Korea’s good performance is largely driven by the strong performance of index heavyweights, Samsung Electronics and SK Hynix. These Korean chip manufacturers are riding on investors’ expectation that the huge and growing AI demand will result in a global memory shortage. Meanwhile, Taiwan continued to rally as the main supply chain for global AI hardware production.
South Asia lagged
However, North Asia’s strength was offset by significant foreign outflows from India, where investors pulled US$16.8 billion through September 26, approaching record levels. The region's performance was underpinned by continued AI-related optimism, particularly benefiting North Asian markets, while central bank policy divergence and geopolitical tensions created volatility across currencies and bonds.
Meanwhile over in the ASEAN region, Indonesia faced political uncertainty following Finance Minister Sri Mulyani Indrawati's sudden removal on 8 September. The Philippines market also sold off on worries of political corruption surrounding a number of large infrastructure projects, especially those linked to flood mitigation.
Policy disparities
There were also disparities in monetary policy action across various central banks. Bank Indonesia surprised markets with a 25bp rate cut to 4.75 percent on September 17, despite rupiah weakness.
On the other hand, the Reserve Bank of Australia (RBA) held rates at 3.60 percent and warned that Q3 inflation may be stronger than expected, signaling patience on further cuts. Malaysia's central bank also maintained rates at 2.75 percent, as did the Reserve Bank of India (RBI), keeping rates steady at 5.5 percent. However, the RBI cut FY26 inflation forecasts to 2.6 percent and raised GDP forecasts to 6.8 percent.
AI-Augmented Asia Solutions

United Asia Fund
- Strong performance: Last month, the Fund maintained its positive momentum, even after a big positive month in August. It returned 7.65 percent, outperforming its benchmark by 0.31 percent.
| 1M | 1Y | 3Y | |
| United Asia Fund | 7.65% | 11.04% | 13.09% |
| Benchmark | 7.34% | 17.85% | 14.61% |
Source: Morningstar. Performance as of 30 September 2025, SGD basis, with dividends and distributions reinvested, if any. Fund refers to United Asia Fund – A SGD Acc. Benchmark: April 1992 – December 2011: MSCI AC FE ex-Japan; January 2012 to present: MSCI AC Asia ex-Japan. Performance figures for 1 month till 1 year show the per cent change, while performance figures above 1 year show the average annual compounded returns.
- Sector rotation: Our significant outperformance in August was due largely to our overweight positions in China AI/Tech and Healthcare (Biotech) sectors. Both sectors pulled back in September, but we had already taken steps to diversify our risks, prompted by our expectation that the China market rally is set broaden out.
Our timely actions saw us rotating out of these sectors and into new themes such as steel and cement. These materials are starting to benefit from the Chinese government’s anti-involution policies. As a result, we were able to mitigate the negative impact on our portfolio caused by profit-taking within the AI sector. - Global interest: That said, large cap tech stocks like Alibaba and Tencent continued to outperform in September. We retained our overweight positions in these stocks as we think they are leveraged on the rise of China-made advanced chips and are indirect but durable beneficiaries of AI demand.
With much cheaper valuations than many companies within the A-share AI hardware components sector, we also think both companies will continue to attract the attention of global tech investors (such as the Ark Innovation ETF) looking for a quick and liquid exposure to the rising China tech sector. - Memory opportunities: We also took some profit in Taiwan tech stocks but we added a Taiwan DRAM play. Alongside our overweight positions in Samsung Electronics and SK Hynix, we believe that a huge shortage in the memory sector is set to emerge as more global tech companies announce their ambitious AI capital expenditure plans.
- India materials: Although we are underweight India, our exposure to the Indian materials sector was one of the biggest contributors to September’s portfolio performance
- Value add from optimisation process: We consistently track our AI-Augmentation approach and can report that our AI-based optimisation process has added substantial value this year. This process is designed to assign optimal weights to stocks selected jointly by analysts and the AI model, based on each stocks’ risk-reward profiles, while ensuring that the risk limits for a particular stock, sector or country are not exceeded.
This year, the AI model has been relatively consistent in its recommendations to increase allocation to stocks that eventually outperform and decrease allocations to stocks that eventually underperform. This has contributed to the Fund’s positive performance so far this year, without taking excessive risks.
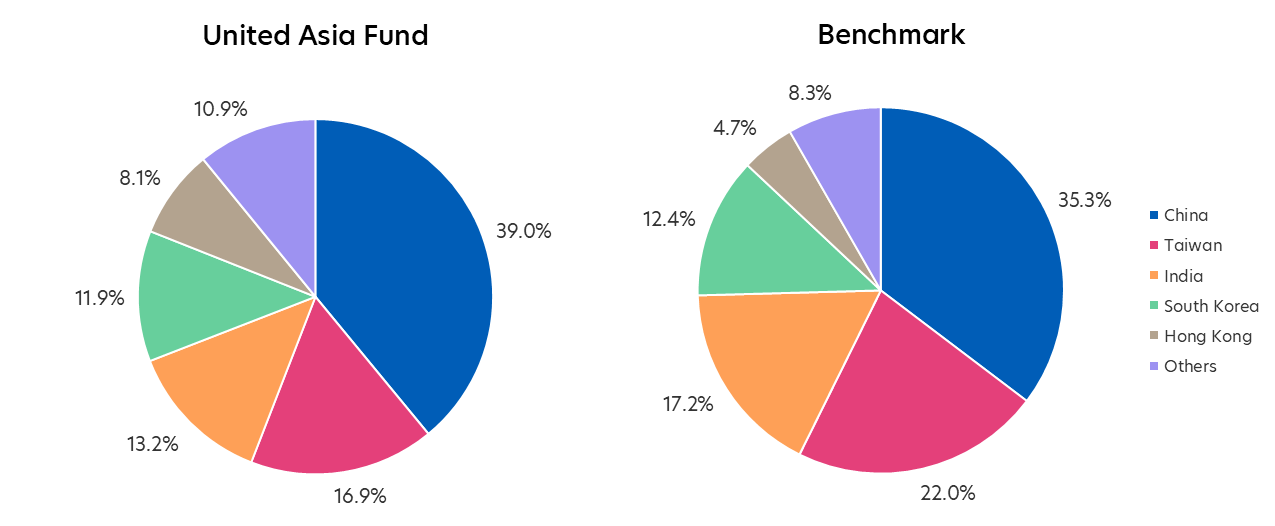
Source: Morningstar. Portfolio rebalancing as of 30 September 2025. Benchmark allocation as of 30 September 2025
Click here for more details on the Fund above.

United Greater China Fund
- Strong Performance: The Fund returned 9.81 percent in the month of September, outperforming its benchmark by 0.34 percent.
| 1M | 1Y | 3Y | |
| United Greater China Fund | 9.81% | 27.64% | 15.87% |
| Benchmark | 9.47% | 30.24% | 18.47% |
Source: Morningstar. Performance as of 30 September 2025, SGD basis, with dividends and distributions reinvested, if any. Fund refers to United Greater China Fund – A SGD Acc. Benchmark: MSCI Golden Dragon Index. Performance figures for 1 month till 1 year show the per cent change, while performance figures above 1 year show the average annual compounded returns.
- Refer above: The strategies driving this Fund’s strong September performance were similar to the United Asia Fund (see above).
- Old and new: For this Fund’s Hong Kong exposure, we held a mixture of new consumption stocks like Laopu Gold, and old school property companies like Fortune REIT.
Rebalancing: Tweaks across Hong Kong, China, Taiwan
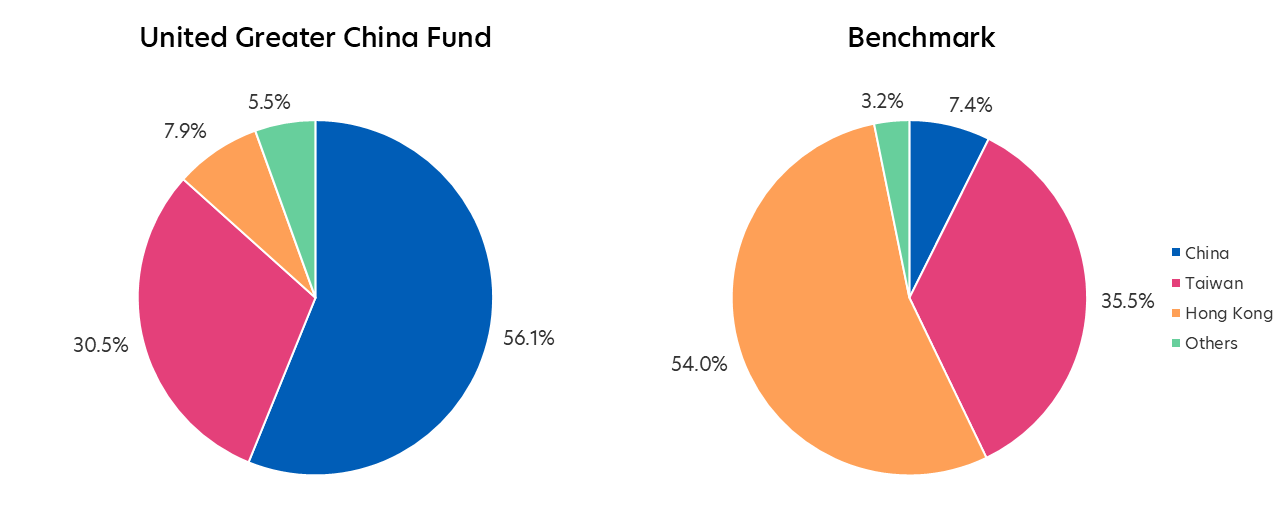
Source: Morningstar. Portfolio rebalancing as of 30 September 2025. Benchmark allocation as of 30 September 2025
Click here for more details on the Fund above.

United ASEAN Fund
- Outperformed the benchmark: In September, the Fund’s return of 1.59 percent outperformed the benchmark return of 0.75 percent.
| 1M | 1Y | 3Y | |
| United ASEAN Fund | 1.59% | 6.08% | 6.67% |
| Benchmark | 0.75% | 6.78% | 7.81% |
Source: Morningstar. Performance as of 30 September 2025, SGD basis, with dividends and distributions reinvested, if any. Fund refers to United ASEAN Fund – A SGD Acc. Benchmark: Jun 86 - Jan 93: 100% DBS 50; Feb 93 - Aug 98: 50% DBS 50, 50% KLEMAS; Sep 98 - May 00: 100% DBS 50; June 00 - May 06: 50% STI Index, 50% KLEMAS; June 06 - June 13: 50% STI Index, 50% KLCI; Jul 13 - present: MSCI ASEAN. Performance figures for 1 month till 1 year show the per cent change, while performance figures above 1 year show the average annual compounded returns.
- Performance contributors: Our stock picks in Indonesia contributed to the fund’s outperformance, along with country allocation decisions to overweight Malaysia and underweight the Philippines.
- AI model favoured miners: In September, our AI-Augmentation model highlighted mining names, including Indonesian gold miners, as having strong return potential. The portfolio has added exposure to select gold mining companies which could benefit from record-high gold prices. These prices are being supported by a weaker US dollar, easing monetary policy, continued central bank purchases, and more recently, uncertainty surrounding the US government shutdown.
- ASEAN markets poised for growth: Looking ahead, we believe ASEAN markets can maintain their positive momentum, supported by the removal of the overhang from US reciprocal tariffs.
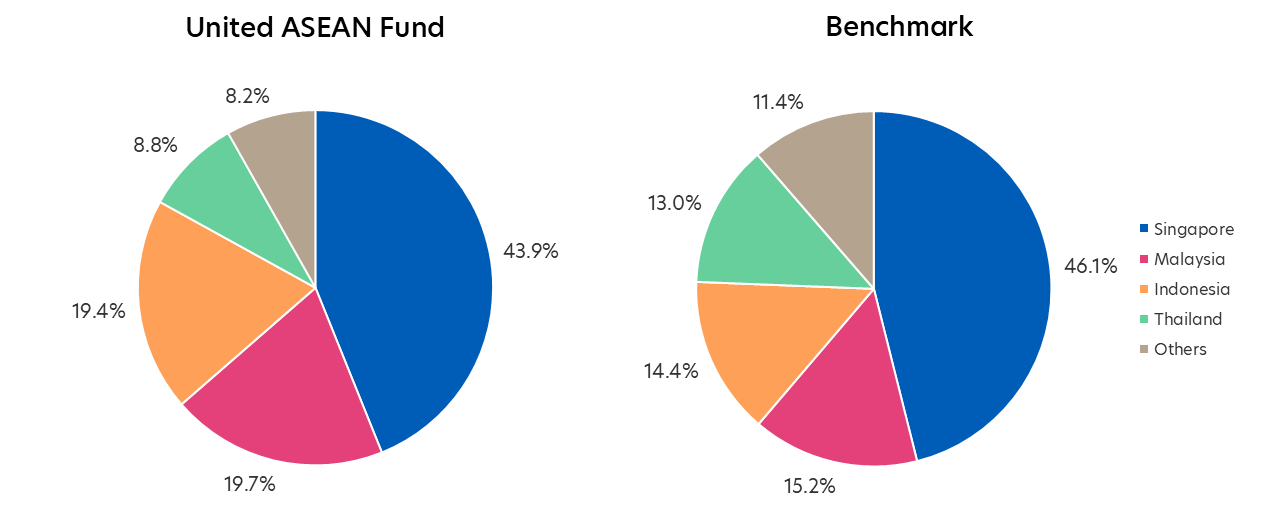
Source: Morningstar. Portfolio rebalancing as of 30 September 2025. Benchmark allocation as of 30 September 2025
Click here for more details on the Fund above.
MSCI Data are exclusive property of MSCI. MSCI Data are provided “as is”, MSCI bears no liability for or in connection with MSCI Data. MSCI full disclaimer here.
All information in this publication is based upon certain assumptions and analysis of information available as at the date of the publication and reflects prevailing conditions and UOB Asset Management Ltd (“UOBAM”)'s views as of such date, all of which are subject to change at any time without notice. Although care has been taken to ensure the accuracy of information contained in this publication, UOBAM makes no representation or warranty of any kind, express, implied or statutory, and shall not be responsible or liable for the accuracy or completeness of the information.
Potential investors should read the prospectus of the fund(s) (the “Fund(s)”) which is available and may be obtained from UOBAM or any of its appointed distributors, before deciding whether to subscribe for or purchase units in the Fund(s). Returns on the units are not guaranteed. The value of the units and the income from them, if any, may fall as well as rise, and is likely to have high volatility due to the investment policies and/or portfolio management techniques employed by the Fund(s). Please note that the graphs, charts, formulae or other devices set out or referred to in this document cannot, in and of itself, be used to determine and will not assist any person in deciding which investment product to buy or sell, or when to buy or sell an investment product. An investment in the Fund(s) is subject to investment risks and foreign exchange risks, including the possible loss of the principal amount invested. Investors should consider carefully the risks of investing in the Fund(s) and may wish to seek advice from a financial adviser before making a commitment to invest in the Fund(s). Should you choose not to seek advice from a financial adviser, you should consider carefully whether the Fund(s) is suitable for you. Investors should note that the past performance of any investment product, manager, company, entity or UOBAM mentioned in this publication, and any prediction, projection or forecast on the economy, stock market, bond market or the economic trends of the markets is not necessarily indicative of the future or likely performance of any investment product, manager, company, entity or UOBAM or the economy, stock market, bond market or economic trends of the markets. Nothing in this publication shall constitute a continuing representation or give rise to any implication that there has not been or that there will not be any change affecting the Funds. All subscription for the units in the Fund(s) must be made on the application forms accompanying the prospectus of that fund.
The above information is strictly for general information only and is not an offer, solicitation advice or recommendation to buy or sell any investment product or invest in any company. This publication should not be construed as accounting, legal, regulatory, tax, financial or other advice. Investments in unit trusts are not obligations of, deposits in, or guaranteed or insured by United Overseas Bank Limited, UOBAM, or any of their subsidiary, associate or affiliate or their distributors. The Fund(s) may use or invest in financial derivative instruments, and you should be aware of the risks associated with investments in financial derivative instruments which are described in the Fund(s)’ prospectus.
Please visit the following for more details on the funds, important notes and the respective funds’ disclaimers.
United Asia Fund: https://www.uobam.com.sg/our-funds/highlights/united-asia-fund/index.page
United Greater China Fund: https://www.uobam.com.sg/our-funds/highlights/united-greater-china-fund/index.page
United ASEAN Fund: https://www.uobam.com.sg/our-funds/funds-details.page?mstarid=F0HKG062HL
This advertisement has not been reviewed by the Monetary Authority of Singapore.
UOB Asset Management Ltd Co. Reg. No. 198600120Z