

Key Points
- S&P, Dow up for 4th straight month; Nasdaq marks first loss in seven months
- US stocks continue to trade sideways over the course of the week
- Investors will continue to keep eyes peeled for signs of rising inflation
The major Wall Street indices edged higher for the week (24-28 May) with the Dow up by 0.9% and the S&P 500 by 1.2% to break their two-week losing streaks, while the Nasdaq Composite rose 2.1% to post its best weekly performance since April 9.
For the month of May, the Dow and S&P 500 were up by 1.9% and 0.6% respectively for their fourth straight monthly gains while the tech-heavy Nasdaq posted a 1.5% monthly loss for the first time in seven months. The Russell 2000 small-cap index had meanwhile clocked its eighth consecutive monthly rise, its longest positive streak since 1995.
Year-to date, techs measured by the S&P IT sector are up 5.9%, lagging the S&P 500’s 12% gain since the start of the year, which was led by cyclicals such as energy (+36.2%), financials (+28.5%), materials (+20.1%) and industrials (+18.3%) while healthcare was up 8.6%.
While US stocks have been broadly trading sideways in the past month amid concerns over rising inflation, the frothy trades over the week in several meme stocks such as AMC – which is 80% owned by retail investors and up 116% for the week – is a continual indication of the latent underlying buoyancy from massive liquidity from both monetary and fiscal support.
However, that has been held back by persistent worries of inflation which has emerged in areas such as US housing prices (though sales number are down) despite the Fed’s views that these are transitory in nature due to post-pandemic reopening anomalies that these will eventually strike an equilibrium once supply and demand are more balanced. The Fed has been reassuring markets that it is cognizant of such developments and will not be tapering its policies anytime soon or too quickly if core inflation exceeds its 2% target.
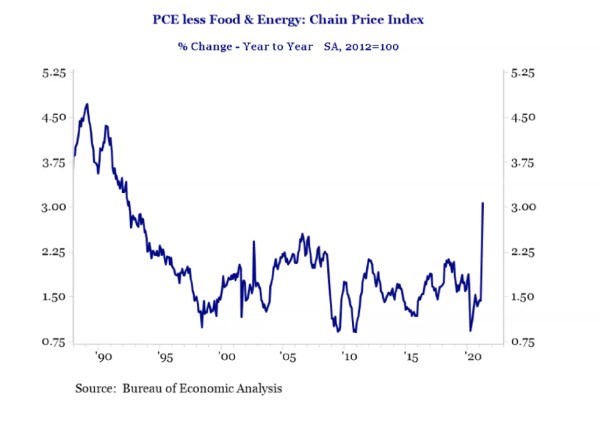
Meanwhile, personal consumption expenditure (PCE) which is the Fed’s preferred yardstick for inflation had ticked up again, weighing in at 3.1% for April – its highest year-on-year increase since 1992, and above economists’ expectations of a 2.9% increase.
Whether inflation is transitory or becoming more entrenched will continue to be the focus of investors in the coming weeks to determine how markets will react amid the backdrop of more fiscal stimulus of up to $6 trillion as proposed by the Biden Administration.
Market response moving forward will also hinge on job numbers which will not only signal if the economic progress is still in a strong recovery mode but also determine the Fed’s course of action including whether it will pare its $120 billion monthly bond purchases which have helped to prop up equities by keeping borrowing costs low for businesses.
Hence all eyes this week will be on the next round of jobs numbers for more signals of the inflation trajectory. That is in addition to manufacturing and services data as well as factory orders. Trading this week will be shortened by the Memorial Day holiday on Monday.
Over in Asia, investors will be watching the manufacturing PMIs for May out of China which is a key indicator of the global industrial cycle, though the primary focus will likely be on the still troubling and unpredictable path of the virus in the region, which has crimped recovery due to renewed virus-triggered lockdowns in many parts of the Asia Pacific realm from Japan in the northern hemisphere to Australia in the south.
This publication shall not be copied or disseminated, or relied upon by any person for whatever purpose. The information herein is given on a general basis without obligation and is strictly for information only. This publication is not an offer, solicitation, recommendation or advice to buy or sell any investment product, including any collective investment schemes or shares of companies mentioned within. Although every reasonable care has been taken to ensure the accuracy and objectivity of the information contained in this publication, UOB Asset Management Ltd ("UOBAM") and its employees shall not be held liable for any error, inaccuracy and/or omission, howsoever caused, or for any decision or action taken based on views expressed or information in this publication. The information contained in this publication, including any data, projections and underlying assumptions are based upon certain assumptions, management forecasts and analysis of information available and reflects prevailing conditions and our views as of the date of this publication, all of which are subject to change at any time without notice. Please note that the graphs, charts, formulae or other devices set out or referred to in this document cannot, in and of itself, be used to determine and will not assist any person in deciding which investment product to buy or sell, or when to buy or sell an investment product. UOBAM does not warrant the accuracy, adequacy, timeliness or completeness of the information herein for any particular purpose, and expressly disclaims liability for any error, inaccuracy or omission. Any opinion, projection and other forward-looking statement regarding future events or performance of, including but not limited to, countries, markets or companies is not necessarily indicative of, and may differ from actual events or results. Nothing in this publication constitutes accounting, legal, regulatory, tax or other advice. The information herein has no regard to the specific objectives, financial situation and particular needs of any specific person. You may wish to seek advice from a professional or an independent financial adviser about the issues discussed herein or before investing in any investment or insurance product. Should you choose not to seek such advice, you should consider carefully whether the investment or insurance product in question is suitable for you.