

- US and China inter-dependency is not easy to unwind
- But relations between the two superpowers are cooling across all fronts
- Investment exposure to both markets now more important than ever
Geo-political relations are floundering
China’s President Xi Jinping was notably absent at this week’s G20 summit. It is the first time he has missed this event since he became president, and there was a time when he seemed to embrace its potential. At the 11th G20 summit held in Hangzhou, China in 2016, President Xi delivered the opening address, stating that the G20 “…must stick together as partners in meeting challenges in order to bring the global economy onto the track of prosperity and stability…”.
But in this age of heightened US-China tensions, it has been speculated that China now perceives this forum to be overwhelmingly dominated by the US and its allies. The fact that the US will be hosting the G20 summit in 2026 (a move that China unsuccessfully opposed) will have only deepened this mistrust.
Trade is also slowing
However, the rift is not only growing on the geo-political front. Amid a dampening of global demand caused by high interest rates, China’s exports have been flatlining or falling. In the first six months of 2023, China’s exports fell by 3.2 percent. But exports to the US fell by significantly more – 25 percent according to the US Commerce department.
So-called “politically-sensitive exports” to the US have declined even more drastically. While China’s overall exports contracted by 8.8 percent in August, politically-sensitive exports to the US fell by 17.4 percent from a year earlier.
As a result, China’s share of US goods imports has shrunk to 13.3 percent, a long way from the 21.6 percent peak reached in 2017, and is set to end the year at a 20-year low. And the fall in trade is not all due to formal government restrictions. Aside from the high tech trade controls, China exports to the US of everything from consumer electronics and clothing to pharmaceuticals, chemicals and industrial equipment are all flagging.
Figure 1: US Imports from China, US$ millions
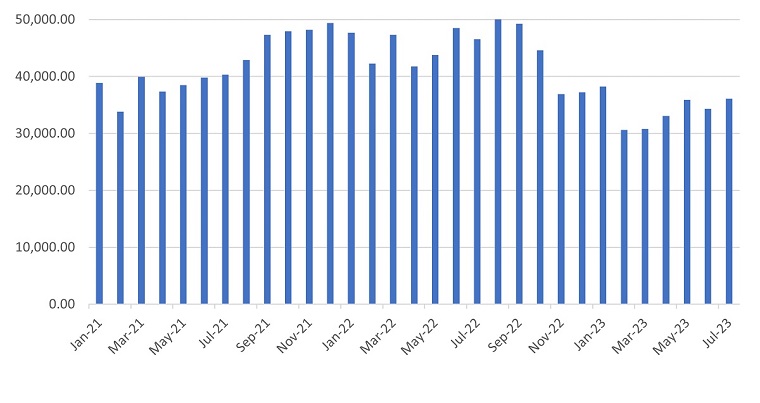
Source: United States Census Bureau, https://www.census.gov/foreign-trade/balance/c5700.html
Supply chain diversification
In the wake of the Covid pandemic and the extended China lockdowns, US companies were spurred into searching for manufacturing alternatives to China.
And part of China’s current tensions with India and President Xi’s G20 no-show could relate to the India’s seeming ascendency at China’s expense. Set to surpass China in 2023 as the world’s most populous country but also one that is highly tech-savvy, India is becoming a viable option for supply chain diversification.
For example, Apple has already moved some of its iPhone production to Tamil Nadu and Karnataka. JP Morgan estimates that by 2025, a quarter of Apple’s iPhones will be manufactured in India. It is also alarming to China that India and the US are historical allies. This was further demonstrated at this week’s G20 summit, with the announcement of a number of US-supported India projects including a rail and shipping corridor linking India to the Middle East and Europe.
Contrasting growth profiles
The G20 summit also comes at a time when China’s economic growth has been under pressure. Over the past few months, China has seen disappointing economic indicators, enabling US President Biden to remark on China’s economic troubles and tout the US as having the “strongest” economy in the world.
However, China’s economy may be turning the corner, with the Caixin General Manufacturing PMI (Purchasing Manufacturers Index) up from 49.2 in July to 51.0 in August, that is, above neutral and the fastest pace of expansion in six months. The government has also recently announced a slew of long-awaited easing measures aimed at reversing the property sector’s decline, and more monetary relaxation is expected soon.
Meanwhile, while we have long stressed our view that a deep recession in the US is unlikely, we do think that inflationary pressures and higher interest rates will persist. This may well take a toll on future US economic growth. The International Monetary Fund is forecasting US GDP to be just 1.0 percent in 2024.
Diverging paths
Hot on the heels of the recent BRICS Summit, China will be hosting the third Belt and Road Forum in October, which 90 countries have already signed up to attend. 2023 marks the tenth anniversary of the Belt and Road initiative, launched by China to boost the trade infrastructure among developing nations and thereby also its global influence.
It has long been evident that China is interested in supporting business groupings that are less dominated by the US. However, it appears that China may be seeing more of its future tied to such alternative global alliances. The implication is that the era of trade globalisation may be transitioning to one that is more bipolar.
Figure 2: China vs US Indices: Oct 2020 – Sep 2023
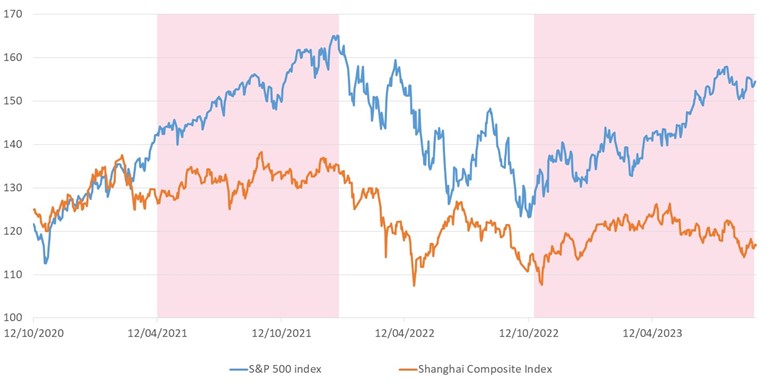
Source: Bloomberg, UOBAM
This bipolarity could also manifest in financial markets with the US and China experiencing different economic and business drivers within different cycles. This means that when one market is rallying, the other may be flat or down, as shown above. It is already the case that the average correlation between the China and US stock markets over the past five years is only 0.4 (0 indicates no correlation, and 1 indicates perfect correlation). Going forward, this number may fall further. This makes it all the more important for investors to ensure good diversification across both markets, and the ability to participate in the best of both worlds.
If you are interested in investment opportunities related to the theme covered in this article, here are two UOB Asset Management Funds to consider:
|
This publication shall not be copied or disseminated, or relied upon by any person for whatever purpose. The information herein is given on a general basis without obligation and is strictly for information only. This publication is not an offer, solicitation, recommendation or advice to buy or sell any investment product, including any collective investment schemes or shares of companies mentioned within. Although every reasonable care has been taken to ensure the accuracy and objectivity of the information contained in this publication, UOB Asset Management Ltd (“UOBAM”) and its employees shall not be held liable for any error, inaccuracy and/or omission, howsoever caused, or for any decision or action taken based on views expressed or information in this publication. The information contained in this publication, including any data, projections and underlying assumptions are based upon certain assumptions, management forecasts and analysis of information available and reflects prevailing conditions and our views as of the date of this publication, all of which are subject to change at any time without notice. Please note that the graphs, charts, formulae or other devices set out or referred to in this document cannot, in and of itself, be used to determine and will not assist any person in deciding which investment product to buy or sell, or when to buy or sell an investment product. UOBAM does not warrant the accuracy, adequacy, timeliness or completeness of the information herein for any particular purpose, and expressly disclaims liability for any error, inaccuracy or omission. Any opinion, projection and other forward-looking statement regarding future events or performance of, including but not limited to, countries, markets or companies is not necessarily indicative of, and may differ from actual events or results. Nothing in this publication constitutes accounting, legal, regulatory, tax or other advice. The information herein has no regard to the specific objectives, financial situation and particular needs of any specific person.You may wish to seek advice from a professional or an independent financial adviser about the issues discussed herein or before investing in any investment or insurance product. Should you choose not to seek such advice, you should consider carefully whether the investment or insurance product in question is suitable for you.
This publication has not been reviewed by the Monetary Authority of Singapore.
UOB Asset Management Ltd. Company Reg. No. 198600120Z