

Are you more tech-exposed than you realise?
In recent years, global mega-cap tech stocks have delivered outsized returns and captured investor attention. As a result, many investors today own portfolios concentrated in tech names, either through direct stock holdings or via broad market indices.
For instance, Information Technology (IT) and Communication Services stocks now form 35 percent1 of the MSCI All Country World Index (ACWI) and 44 percent2 of the S&P 500 index. This means that even index investors could be more exposed to tech than they realise.
Durable companies help to dampen down the risk
While Tech companies offer higher growth potential, they also come with higher volatility. Market sentiment, earnings surprises, and regulatory headlines can all trigger sharp price swings, especially given their lofty valuations.
To hedge against the risks of tech-heavy portfolios, exposure to durable companies can help to provide stability, income, and enhanced diversification. This is particularly pertinent in the current environment given growth uncertainties as US tariff policies start to bite.
So what are durable companies? These are well-managed businesses that can weather economic ups and downs and generate consistent earnings, even in uncertain environments. Such companies typically have lower risk and often pay out attractive dividends thanks to their stable earnings. This can help cushion portfolios against volatility and offer investors a smoother ride through market swings.
Why the United Global Durable Equities Fund (the “Fund”)?
The Fund aims to deliver attractive long-term total returns through a combination of capital appreciation and dividend income. It does so by investing in durable companies from across the world.
To identify such companies, the Fund manager employs a disciplined selection process based on three key criteria:
- Stable and resilient earnings which form the foundation for long-term compounding
- Strong and capable management to enhance the probability of long-term business success
- Moderate valuations to ensure investments are made at reasonable prices
By focusing on these attributes, the Fund aims to generate long-term returns with lower risk than the broader market.
5 key benefits
1. Proven stable, consistent returns
Over the past five years, there were 66 times out of a hundred when an investment in global equities delivered annualised returns of between 8 to 14 percent (as measured using the MSCI ACWI index).
However, the Fund achieved this range of returns 96 times out of a hundred. This means the Fund’s returns are more consistent and less spread out compared to the MSCI ACWI. While the broader index can sometimes see very low or very high returns, the Fund has historically stayed within a steady performance band. This stability is useful for helping investors stay invested, especially during uncertain market conditions.
Fig 1: 5-year rolling monthly returns
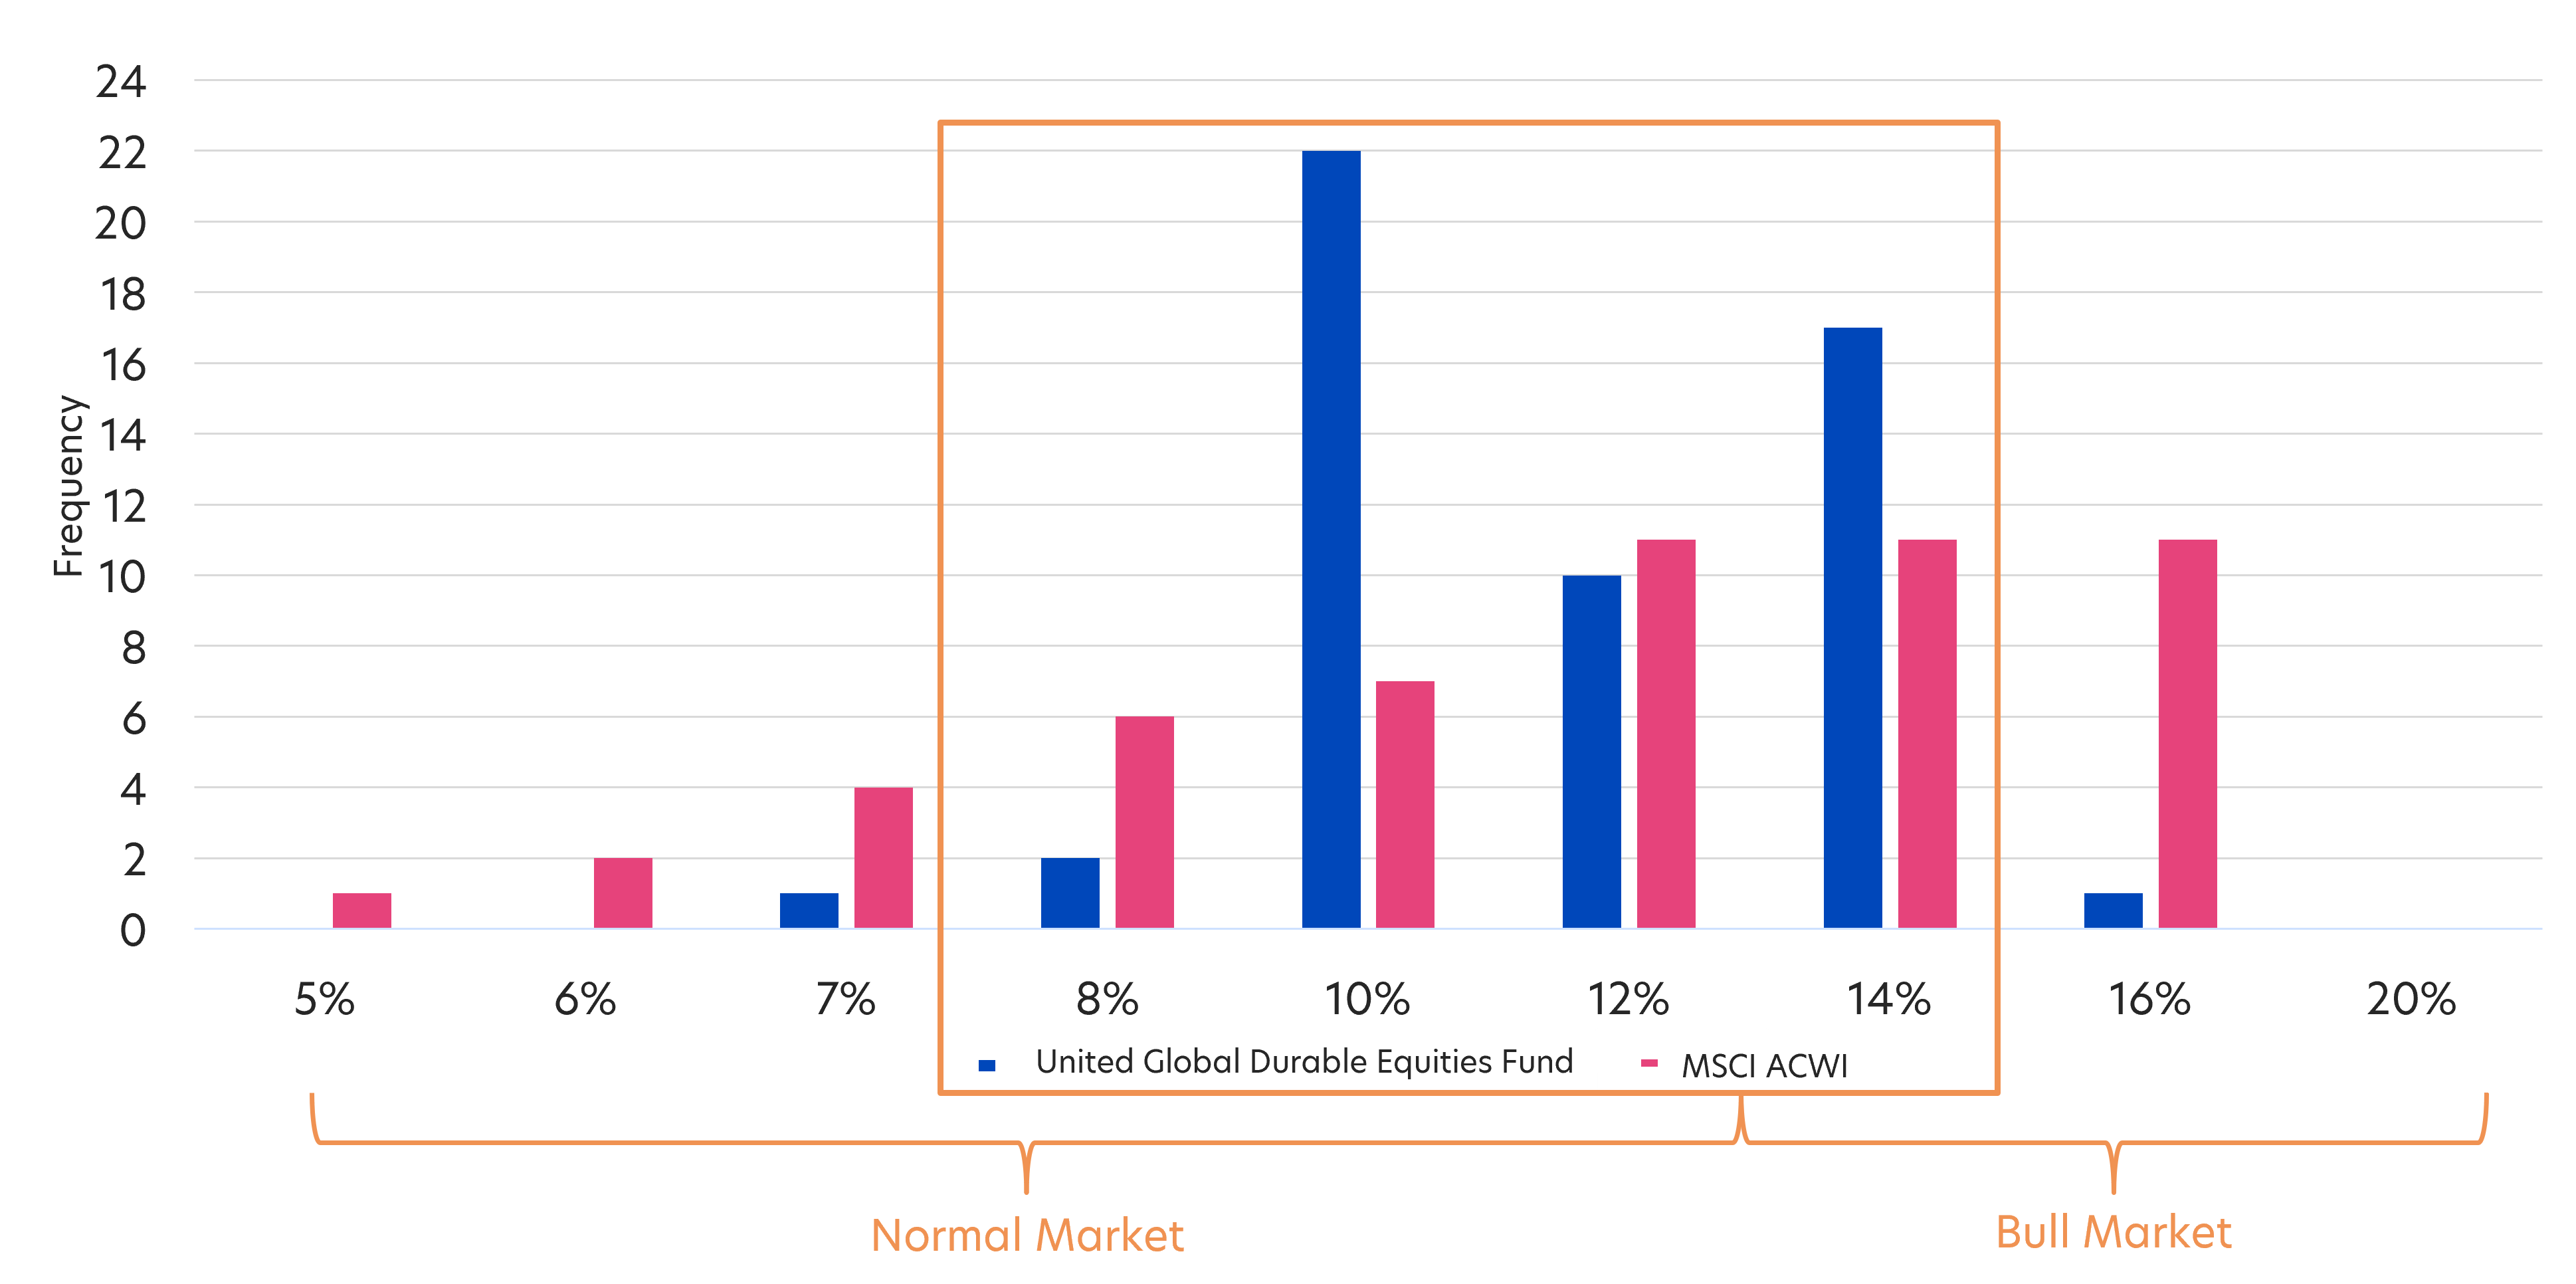
Source: MSCI, Wellington Management, UOBAM, July 2025 | Benchmark used in the calculation of the chart: MSCI All Country World. | Sums may not total due to rounding. Performance returns for periods one year or less are not annualised. |Past performance does not predict future returns. An investment can lose value.
2. Attractive monthly income
Given that interest rates are trending downward and bond yields are moderating, income-focused investors are increasingly seeking alternative sources of yield that don’t require taking on excessive risk. For example, the yield on Singapore 6-month T-bills has dropped sharply, falling from 2.9 percent at the start of the year to 1.7 percent as of 1 August 20253.
In this environment, the Fund offers a compelling option. With a dividend yield of 5.5 percent per annum, paid out monthly (Class A SGD Dist)4, it provides a higher income payout than bonds, but without significantly increasing risk.
This is achieved by investing in durable, resilient companies with consistent earnings, stable cash flows, and disciplined management - characteristics that enable them to deliver regular and attractive dividends. Additionally, more than one-third of the Fund is invested in financial companies like banks and insurers. Such companies are typically strong dividend payers and play a key role in boosting the Fund’s overall yield.
3. Winning by not losing
The Fund’s focus on durable companies has also helped it to experience lower drawdowns during periods of market volatility. This is important because avoiding large losses is key to long-term capital compounding. When portfolios don’t drop significantly during downturns, they don’t need to rebound as much to get back to par, allowing gains to build steadily over time.
Here’s how the Fund has performed against the MSCI ACWI during volatile periods over the past several years.
|
|
United Global Durable Equities |
MSCI ACWI |
Outperformance |
|
2020 COVID pandemic |
-20.34% |
-21.36% |
1.03% |
|
2022 rising rate environment |
-16.93% |
-25.62% |
8.70% |
|
2023 higher for longer volatility |
-7.61% |
-9.62% |
2.01% |
Source: Wellington Management, UOBAM, July 2025. Returns calculated in USD terms. Past performance does not predict future returns.
4. Meaningful diversification
The United Global Durable Equities Fund offers exposure to companies that are often underrepresented in traditional global equity portfolios.
A comparison between the Fund’s top 10 holdings and those of the MSCI ACWI reveals no overlaps, highlighting its differentiated approach. Instead, the Fund invests in lesser-known names that nonetheless offer good total return potential.
Fig 2: Fund top 10 holdings, as of 31 July 2025
|
Company |
Description |
Weight (%) |
|
FinecoBank |
Italian bank |
5.7 |
|
US Foods |
US food service distributor |
5.3 |
|
HDFC Bank |
Indian bank |
5.0 |
|
Globe Life |
US insurance company |
4.8 |
|
Intact Financial |
Canadian insurance company |
4.8 |
|
PTC |
US software company |
4.6 |
|
Nasdaq |
US stock exchange operator |
4.6 |
|
ITOCHU |
Japanese conglomerate; owner of FamilyMart |
4.1 |
|
Constellation Software |
Canadian software company |
3.9 |
|
Reckitt Benckiser Group |
UK consumer goods company; portfolio brands include Dettol, Strepsils, Vanish |
3.9 |
Source: UOBAM, as of 31 July 2025
The Fund also differs from the MSCI ACWI in terms of sector allocation, offering a differentiated exposure that pairs well with conventional global equity portfolios that may be more tech heavy.
It holds a higher proportion of Financials and Industrials, sectors that typically offer stronger dividend potential, while maintaining a lower allocation to IT stocks. Notably, the Fund has no exposure to Communication Services, Energy, and Real Estate, further distinguishing its sector profile from traditional global equity portfolios.
Fig 3: Fund sector allocation vs MSCI ACWI (%)
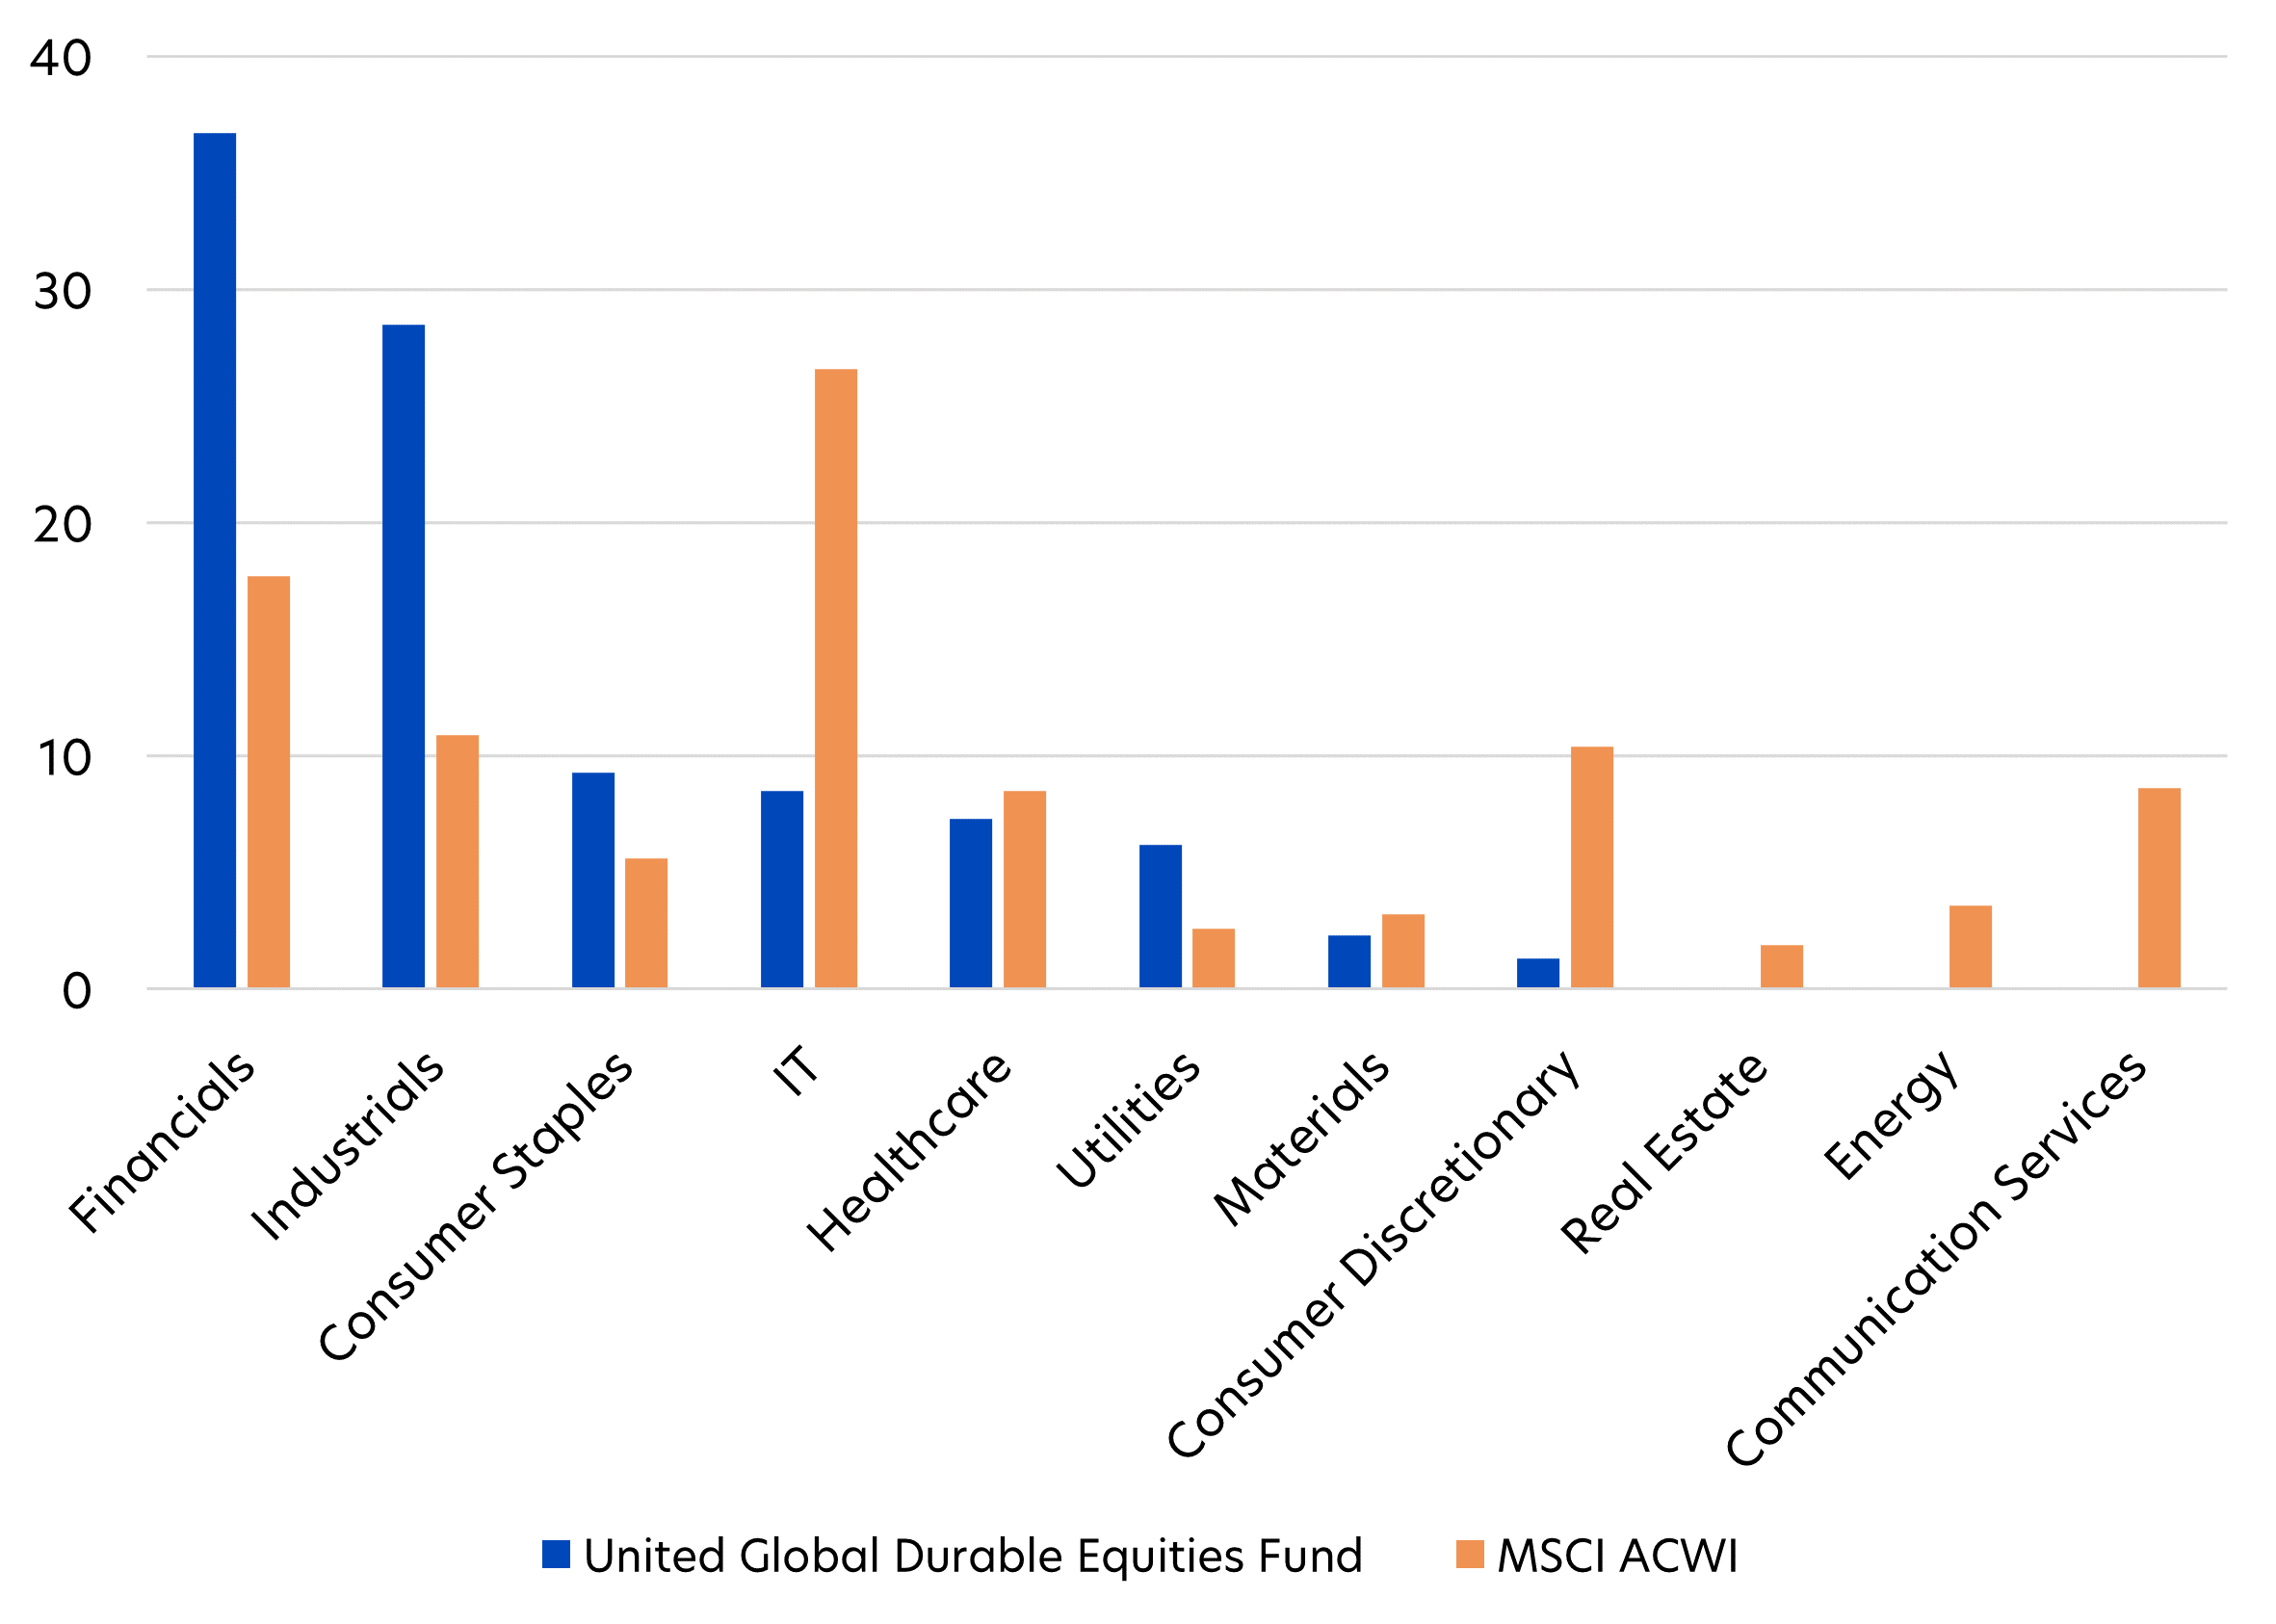
Source: Wellington Management, UOBAM, MSCI, as of 31 July 2025
5. Solid risk-adjusted performance
The Fund is actively managed without reference to any benchmark. However, the MSCI ACWI is used as a reference point to gauge broad equity market performance.
Over the past three years, the Fund has delivered strong returns with lower volatility compared to both its peers and the MSCI ACWI. This highlights the effectiveness of its investment strategy, which focuses on durable, dividend-paying companies across diverse sectors and geographies.
|
|
Cumulative returns (%) |
Annualised returns (%) |
Risk (%) |
|
|
|
Year-to-date |
1-year |
3-year |
3-year standard deviation |
|
United Global Durable Equities Fund |
5.69 |
7.08 |
8.54 |
10.19 |
|
Peers |
6.45 |
8.19 |
8.15 |
11.41 |
|
MSCI ACWI |
6.08 |
12.4 |
12.83 |
11.59 |
Source: Morningstar, MSCI as of 31 July 2025. | Refers to United Global Durable Equities Fund – Class SGD Dist | Fund performance is calculated on a NAV to NAV basis. Past performance is not necessarily indicative of future performance. | Peers category (Morningstar): Global Flex-Cap Equity. Does not include the effect of the current subscription fee that is charged, which an investor might or might not pay.
Fund details
|
United Global Durable Equities Fund, as of 31 July 2025 |
|
|
Investment objective |
The Fund seeks total return consisting of capital appreciation and income over the long term by investing primarily in equity and equity related securities of companies listed and traded on stock exchanges globally. |
|
Distribution Policy |
Distributions (if any) will only be made in respect of the Distribution Classes of the Fund. |
|
Fund class available5 |
Class A SGD Acc |
|
Subscription mode |
Cash – USD Acc & Dist |
|
Management fee |
Currently 1.75% p.a.; maximum 2.5% p.a. |
|
Subscription fee |
Currently up to 5%; maximum 5% |
|
Minimum subscription / trading size |
S$1,000/US$1,000 (initial) |
1Source: MSCI ACWI, as of 31 July 2025
2Source: S&P 500, as of 31 July 2025
3Source: MAS T-bill auction results
4Distributions are not guaranteed. Distributions may be made out of income, capital gains and/or capital. This relates to the disclosed distribution policy as set out in the Fund’s prospectus.
5Investors should refer to the Fund’s prospectus for more details on the different classes available.
|
If you are interested in investment opportunities related to the theme covered in this article, here is a UOB Asset Management Fund to consider:
|
MSCI Data are exclusive property of MSCI. MSCI Data are provided "as is", MSCI bears no liability for or in connection with MSCI Data. MSCI full disclaimer here.
All information in this publication is based upon certain assumptions and analysis of information available as at the date of the publication and reflects prevailing conditions and UOB Asset Management Ltd (“UOBAM”)'s views as of such date, all of which are subject to change at any time without notice. Although care has been taken to ensure the accuracy of information contained in this publication, UOBAM makes no representation or warranty of any kind, express, implied or statutory, and shall not be responsible or liable for the accuracy or completeness of the information.
Potential investors should read the prospectus of the fund(s) (the “Fund(s)”) which is available and may be obtained from UOBAM or any of its appointed distributors, before deciding whether to subscribe for or purchase units in the Fund(s). Returns on the units are not guaranteed. The value of the units and the income from them, if any, may fall as well as rise, and is likely to have high volatility due to the investment policies and/or portfolio management techniques employed by the Fund(s).
Please note that the graphs, charts, formulae or other devices set out or referred to in this document cannot, in and of itself, be used to determine and will not assist any person in deciding which investment product to buy or sell, or when to buy or sell an investment product. An investment in the Fund(s) is subject to investment risks and foreign exchange risks, including the possible loss of the principal amount invested. Investors should consider carefully the risks of investing in the Fund(s) and may wish to seek advice from a financial adviser before making a commitment to invest in the Fund(s). Should you choose not to seek advice from a financial adviser, you should consider carefully whether the Fund(s) is suitable for you. Investors should note that the past performance of any investment product, manager, company, entity or UOBAM mentioned in this publication, and any prediction, projection or forecast on the economy, stock market, bond market or the economic trends of the markets is not necessarily indicative of the future or likely performance of any investment product, manager, company, entity or UOBAM or the economy, stock market, bond market or economic trends of the markets. Nothing in this publication shall constitute a continuing representation or give rise to any implication that there has not been or that there will not be any change affecting the Funds. All subscription for the units in the Fund(s) must be made on the application forms accompanying the prospectus of that fund.
The above information is strictly for general information only and is not an offer, solicitation advice or recommendation to buy or sell any investment product or invest in any company. This publication should not be construed as accounting, legal, regulatory, tax, financial or other advice. Investments in unit trusts are not obligations of, deposits in, or guaranteed or insured by United Overseas Bank Limited, UOBAM, or any of their subsidiary, associate or affiliate or their distributors. The Fund(s) may use or invest in financial derivative instruments and you should be aware of the risks associated with investments in financial derivative instruments which are described in the Fund(s)’ prospectus.
This advertisement has not been reviewed by the Monetary Authority of Singapore.
UOB Asset Management Ltd Co. Reg. No. 198600120Z