

What has happened so far?
Following a challenging 2022, the first half of 2023 has seen some stabilisation of REITs markets globally. Last year, rising inflation and interest rates caused REITs markets to decline by between 5 to 25 percent. Since then, the sector has seen a tentative recovery, although it is still a long way from levels reached at the end of 2021.
Fig 1: Cumulative total return of Global REITs (%), Jan 2022 – April 2023
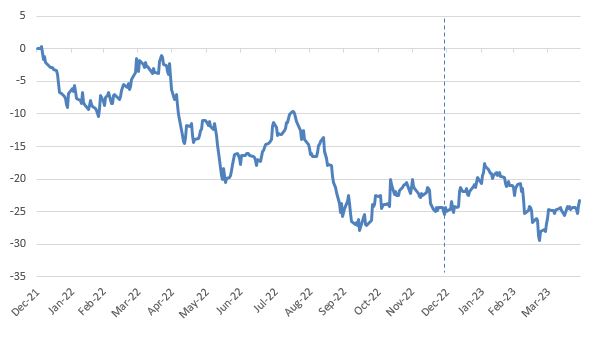
Source: Bloomberg. FTSE EPRA/NAREIT Global REITs Index (ENXGUS)
So why do REITs still attract so much attention?
Despite the recent price volatility, REITs continue to see good demand from investors. This is because capital growth is not REITs’ only appeal. A large percentage of rents collected from REITs properties are passed on to investors in the form of income payouts. In many countries and regions (except the US), these payouts are well above deposit rates, and therefore highly attractive to income-seeking investors.
Fig 2: Average REITs dividend yield vs interest rates (%)
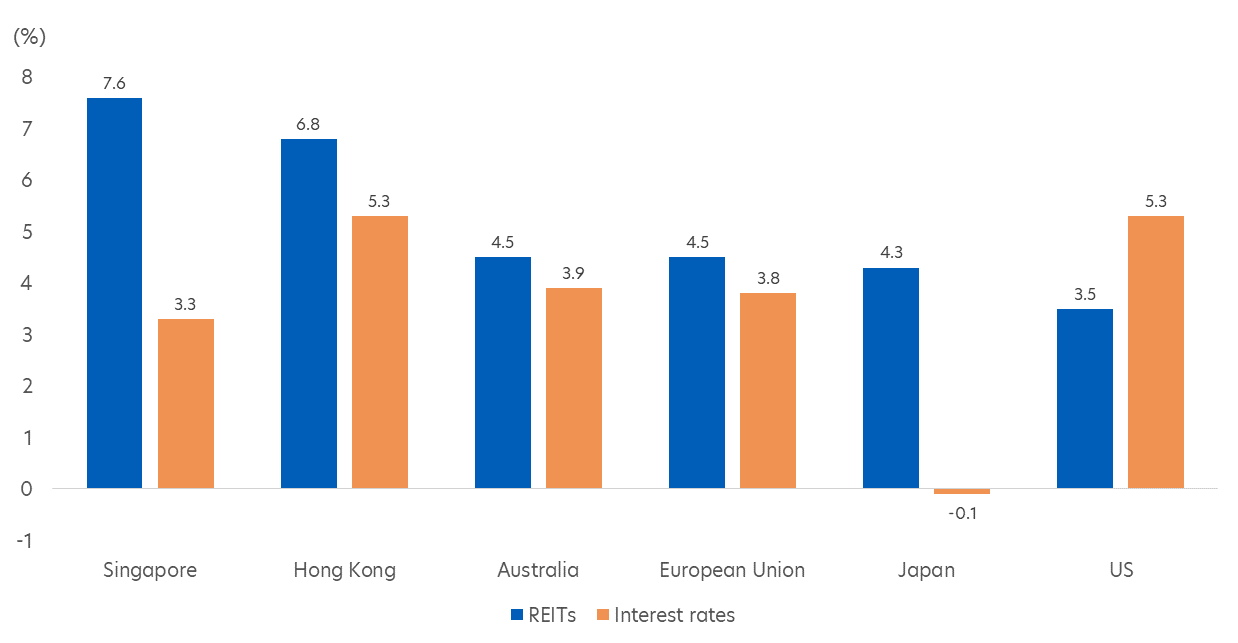
Source: Trading Economics/S&P Global Intelligence/ASX/UOBAM. Data as of 31 March 2023
Looking ahead, 5 trends stand out for the REITs market.
1. Peaking interest rates bode well for REITs
Fig 3: US Fed Funds Rate, Mar 2022 – May 2023
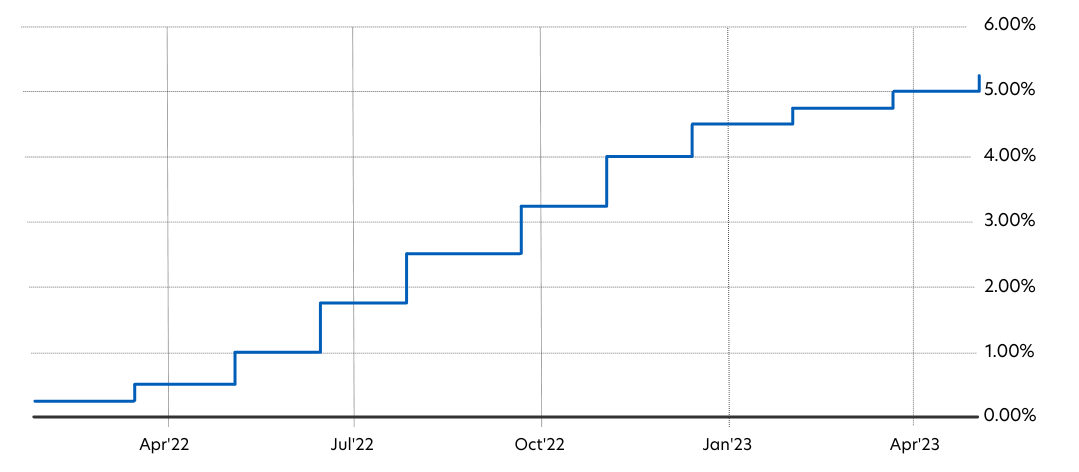
Source: Trading Economics, May 2023
Most central banks, in step with the US Fed, look likely to have already reached the end of their rate hiking cycle or are soon to do so. Many investors are optimistic that inflation has been tamed without lasting damage to the global economy.
This backdrop has the potential for:
- Higher corporate activity within the real estate sector
- A lift in property values as demand resumes
- Improved sentiment towards risk assets
2. REITs appear attractively priced given strong fundamentals
Fig 4: Average interest coverage ratio for key APAC REITs markets
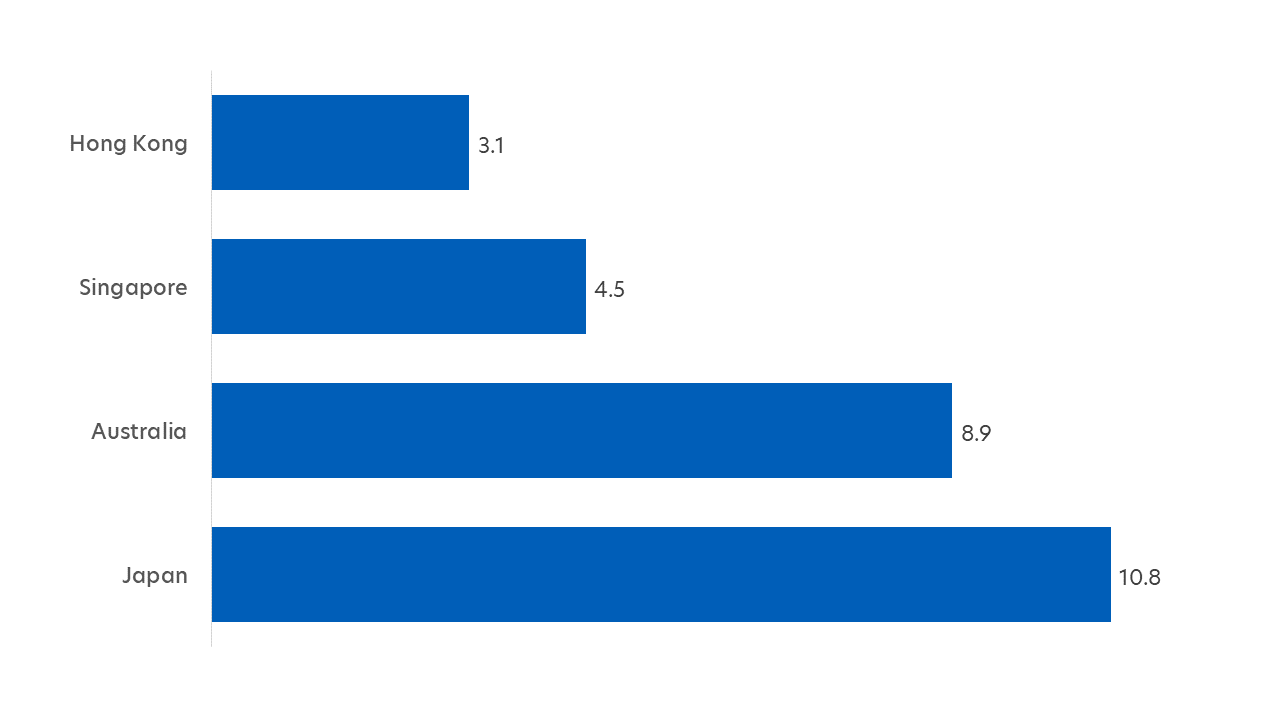
Source: Bloomberg/UOBAM. Based on a simple average calculation of the interest coverage ratio for REITs in the following indices: Singapore (FTSE ST REIT SGD – Singapore REITs). Japan (TSE REIT), Australia (S&P / ASX 200 A-REIT), Hong Kong (Hang Seng REIT)
The property sector continues to enjoy strong operating fundamentals including:
- Good ability to meet its debt obligations. For example, the interest coverage ratio (i.e. earnings divided by interest expenses) for most Singapore REITs is well above the MAS’s minimum requirement of 2.5 times
- Net property income is rising, especially for industrial, hospitality and retail REITs sectors
- Given these strong fundamentals and last year’s underperformance, REITs now appear attractively valued
3. Asia Pacific REITs markets show good recovery prospects
Fig 5: Cumulative total return of REITs markets (%), Year to Date
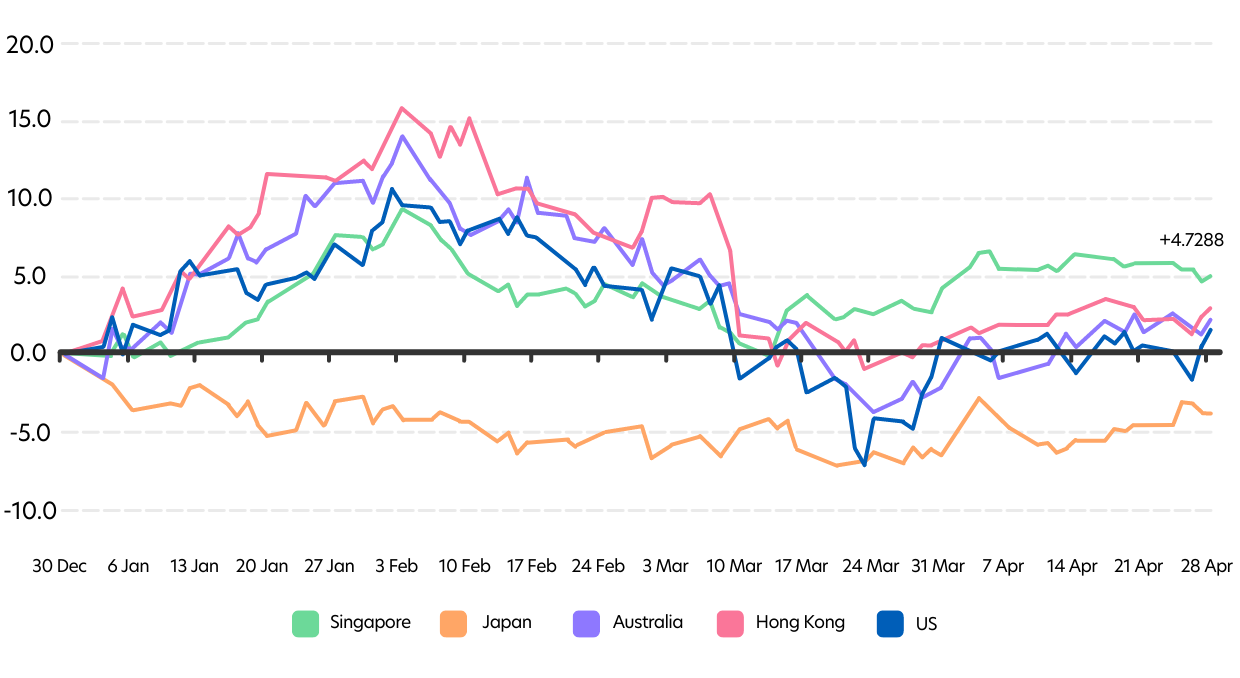
Source: Bloomberg/UOBAM. Based on the following indices: Singapore (FTSE ST REIT SGD – Singapore REITs). Japan (TSE REIT), Australia (S&P / ASX 200 A-REIT), Hong Kong (Hang Seng REIT), US (Nareit Equity REITs (FNER))
Asia Pacific (APAC) REITs markets are showing more resilience than US REITs and have stronger growth prospects given the following:
- North Asian REITs markets are likely to benefit from a positive earnings outlook with China reopening to provide support
- ASEAN REITs markets will likely see a continuation of its reopening trend which should drive an uplift of its services sector
- The Singapore REITs sector offers one of APAC’s most attractive distribution per unit (DPU) growth profiles, making it a major outperformer
To learn more, watch Low Soo Fang, Asia Equities Portfolio Manager at UOBAM, as she shares her outlook for APAC REITs.
4. Commercial real estate (CRE) risks are muted in Asia, especially Singapore
Fig 6: Office vacancy rates by region (%)
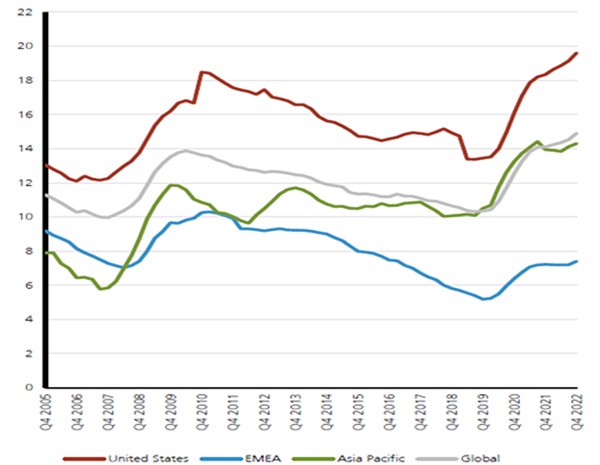
Source: UBS Research as at Apr 2023
Fig 7: CRE loans as % of total loans (US & SG)
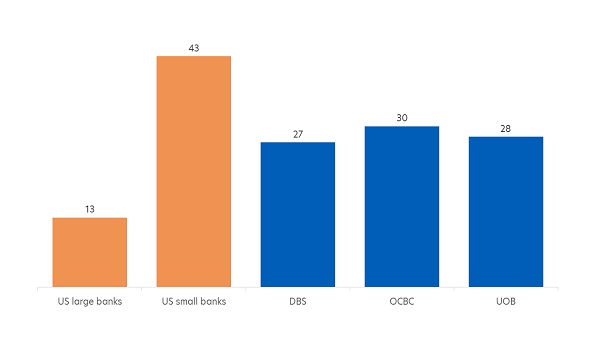
Source: JP Morgan Research as at 30 Mar 2023
While there has been considerable nervousness about the weakening US' office sector and the low post-Covid return-to-office rate, in APAC the situation is more resilient:
- Office vacancy rates in Asia are lower than in the US. This is because the US’s return-to-office rate is 50 percent, compared to APAC’s 70 – 80 percent.
- This also means that Singapore office landlords can charge higher office rents. Singapore’s office rental growth of 10.4 percent for 2022 is the second highest in the Asia Pacific region.
- At the same time, Singapore banks have a lower exposure to the CRE sector, with only 27 – 30 percent of their loans in CRE, compared to 43 percent for US small banks.
5. APAC industrial REITs set to outperform

Peaking interest rates tend to be positive for industrial REITs and 2023 is expected to be no different. As such, UOB Asset Management is constructive on REITs, based on the following sector outlook:
- Industrial: Solid performance expected
- Retail: Recovery on track
- Hospitality: Momentum to pick up
- Office: A potential mixed bag
If you are interested in investment opportunities related to the theme covered in this article, here is a UOB Asset Management Fund to consider:
|
This publication shall not be copied or disseminated, or relied upon by any person for whatever purpose. The information herein is given on a general basis without obligation and is strictly for information only. This publication is not an offer, solicitation, recommendation or advice to buy or sell any investment product, including any collective investment schemes or shares of companies mentioned within. Although every reasonable care has been taken to ensure the accuracy and objectivity of the information contained in this publication, UOB Asset Management Ltd (“UOBAM”) and its employees shall not be held liable for any error, inaccuracy and/or omission, howsoever caused, or for any decision or action taken based on views expressed or information in this publication. The information contained in this publication, including any data, projections and underlying assumptions are based upon certain assumptions, management forecasts and analysis of information available and reflects prevailing conditions and our views as of the date of this publication, all of which are subject to change at any time without notice. Please note that the graphs, charts, formulae or other devices set out or referred to in this document cannot, in and of itself, be used to determine and will not assist any person in deciding which investment product to buy or sell, or when to buy or sell an investment product. UOBAM does not warrant the accuracy, adequacy, timeliness or completeness of the information herein for any particular purpose, and expressly disclaims liability for any error, inaccuracy or omission. Any opinion, projection and other forward-looking statement regarding future events or performance of, including but not limited to, countries, markets or companies is not necessarily indicative of, and may differ from actual events or results. Nothing in this publication constitutes accounting, legal, regulatory, tax or other advice. The information herein has no regard to the specific objectives, financial situation and particular needs of any specific person.You may wish to seek advice from a professional or an independent financial adviser about the issues discussed herein or before investing in any investment or insurance product. Should you choose not to seek such advice, you should consider carefully whether the investment or insurance product in question is suitable for you.
UOB Asset Management Ltd. Company Reg. No. 198600120Z