

Also known as S-REITs, this sector is recovering from last year’s volatility, with more upside expected.
Why S-REITs?

Large size
Despite being a small country, Singapore is the second largest REIT market in Asia after Japan1.

Healthy returns
S-REITs are a good investment tool for regular income, providing an average dividend yield of 7.6%2. The 10-year total return was 62.9%2, according to the FTSE ST REIT Index.

Important to Singapore
The S-REITs sector has a combined market capitalisation of $98B and makes up about 12 percent2 of the Singapore Exchange’s (SGX) market capitalisation.

Global exposure
Over 90%2 of S-REITs and property trusts hold overseas assets across Asia Pacific, South Asia, Europe and the US. There are 17 S-REITs2 portfolios comprising entirely of overseas properties.

Sector diversified
S-REITs have well-diversified property sub-segments. including Industrials, Retail, Office, Hospitality, and Healthcare.

Good governance
The market benefits from a strong governance and regulatory framework. As a result, the market’s compound annual growth rate (CAGR) over the past 10 years is 7%.2
How does S-REITs yields compare to other asset classes?
| Asset Class | Yield |
| Average of all S-REITs* | 7.6% |
| STI Index* | 4.1% |
| Government 10-Y Bond^ | 3.1% |
| MAS Core Inflation Rate** | 5.1% |
* Source: SGX, based on 12M Average Dividend Yield
^ Source: SGX, based on 10 Year Yield
** Source: MAS, based on November 2022 statistics
S-REITs yields are high compared to other asset classes.
How correlated is S-REITs to other asset classes?
| Correlation between S-REITs and other asset classes | |
| US Equities | 0.61 |
| US Bonds | 0.67 |
| Global Equities | 0.65 |
| Global Bonds | 0.66 |
| Asia Ex Japan Equities | 0.70 |
| Asia Bonds | 0.73 |
Note: Figures refer to price correlation. A correlation coefficient of 1 means that there is a perfect positive correlation between the two assets ie they can be expected to move exactly in tandem. A zero correlation coefficient implies that there is no linear relationship at all.
S-REITs has a relatively low correlation to global bonds and equities.
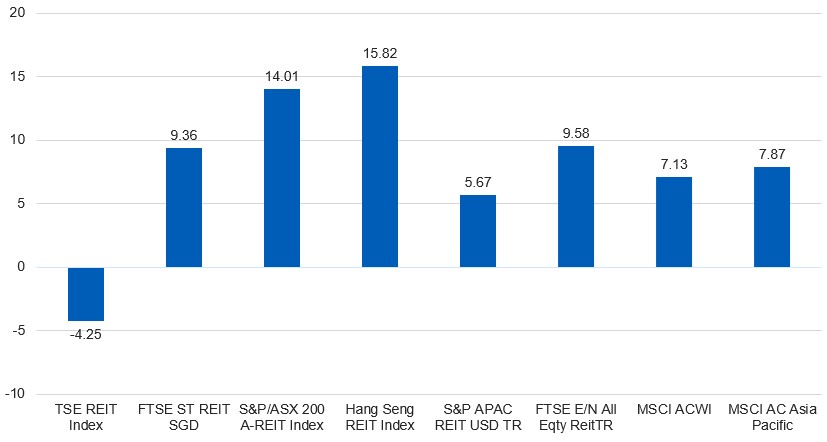
How did S-REITs perform in 2022?
2022 was a challenging year for the global REITs sector. Rate hikes and slowing global growth dampened sentiment in the sector. As a result, the FTSE ST REIT Index – the benchmark for S-REITs – fell by 10.7 percent in 2022, but still outperformed the global REITS sector, which fell close to 25 percent (based on the FTSE EPRA/NAREIT Global REIT Index).
However, REITs are making a comeback with solid fundamentals, the continued reopening of economies and expectations of lower interest rates. APAC REITs markets kicked off this year on a strong note, buoyed by China’s reopening and policy shifts.
Figure 1: Performance of REIT markets YTD % (as at 6 Feb 2023)
Which sub-sectors have performed well in the 2023 rally?
Figure 2: Performance of S-REITs YTD (by sector)
| 2022 |
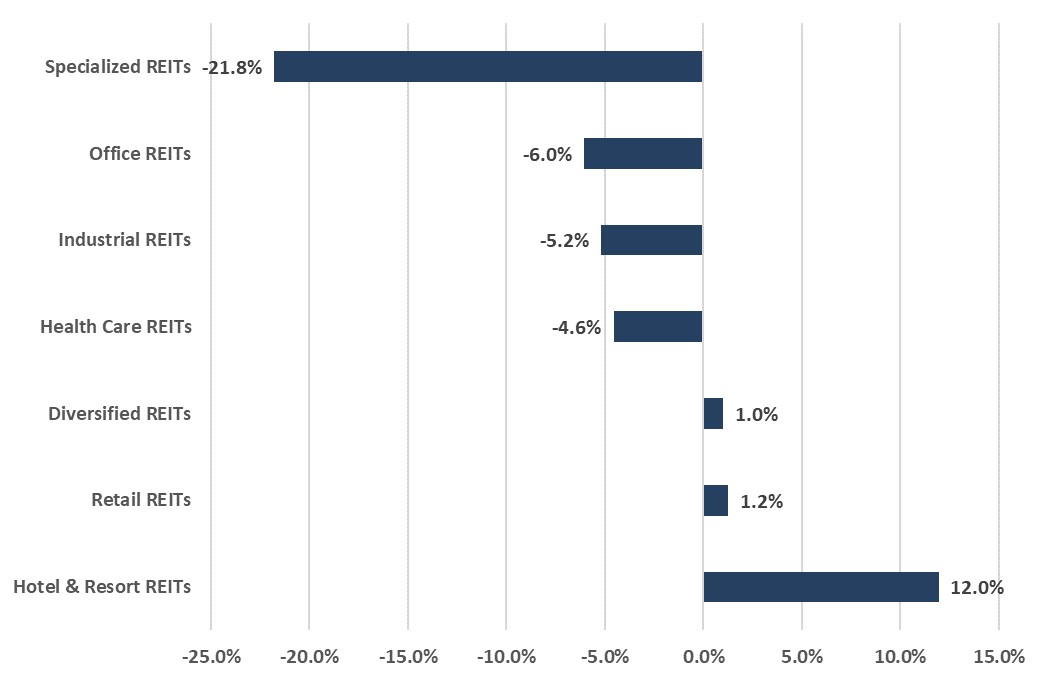 |
| YTD |
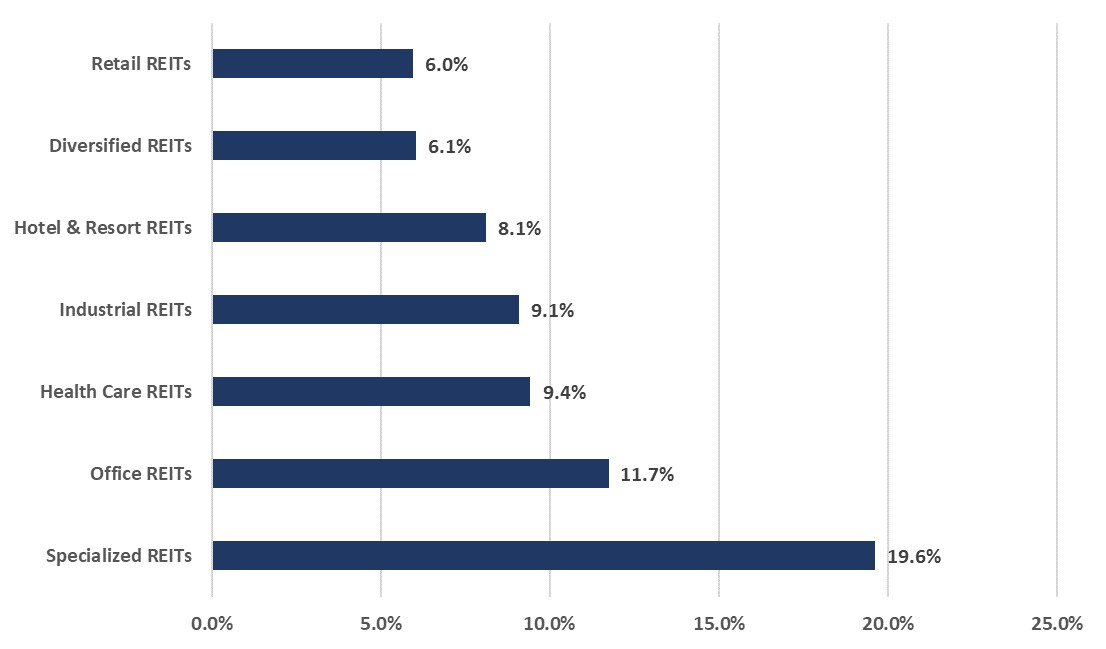 |
Note: FTSE ST REIT Index – SG REITs. Source: Bloomberg, UOBAM as at 6 Feb 2023
The underperformers last year have seen a rebound recently. Specialised REITs are leading the pack with a 19.6% return YTD. All sub-sectors have recorded positive returns ranging from 6.0% to 19.6% YTD.
What is the outlook for S-REITs?
- We believe that the fundamentals and capital values of REITs are holding up well in Singapore. Despite the country’s subdued macroeconomic backdrop, property-level fundamentals and earnings growth across the sectors remain healthy thereby cushioning any downside risks.
- SREITs have robust operating metrics, with the strongest being the office and hospitality sectors, followed by the industrial sector, and lastly the retail sector.
- We believe strong SGD and resilient asset values would allow S-REITs to be seen as long-term inflation hedges.
- The steady asset values in Singapore are supported by stable cap rates and higher rents, which helps to mitigate the negative effect from cap rate expansion experienced by overseas assets, which leads to lower asset values.
- The Monetary Authority of Singapore (MAS) implements a minimum interest coverage ratio (ICR) which determines whether a company can pay off its debts. Most S-REITs have an ICR that is comfortably above the minimum 2.5x imposed by the MAS, which means they have sufficient buffer to increase their leverage.
- A rate pause or cut in 2023 will provide greater clarity in terms of financing costs for S-REITs. This should lead to greater earnings visibility and dividend distributions.
- China’s earlier-than-expected reopening has provided a fillip to S-REITs, and the resumption of Chinese travel will help sustain the recovery, particularly for hospitality and retail REITs given the return of Chinese tourists.
Overall, we are constructive on the medium-term outlook and cautious on a near-term pullback. Our focus would be on S-REITs with earnings prospects as rate play and reopening fades. Valuation is supportive despite the rally with further upside, as the sector mean reverts.
1REITAS, Overview of the S-REITs industry, December 2022
2SGX Group, Chartbook: SREITs & Property Trusts, January 2023
This publication shall not be copied or disseminated, or relied upon by any person for whatever purpose. The information herein is given on a general basis without obligation and is strictly for information only. This publication is not an offer, solicitation, recommendation or advice to buy or sell any investment product, including any collective investment schemes or shares of companies mentioned within. Although every reasonable care has been taken to ensure the accuracy and objectivity of the information contained in this publication, UOB Asset Management Ltd (“UOBAM”) and its employees shall not be held liable for any error, inaccuracy and/or omission, howsoever caused, or for any decision or action taken based on views expressed or information in this publication. The information contained in this publication, including any data, projections and underlying assumptions are based upon certain assumptions, management forecasts and analysis of information available and reflects prevailing conditions and our views as of the date of this publication, all of which are subject to change at any time without notice. Please note that the graphs, charts, formulae or other devices set out or referred to in this document cannot, in and of itself, be used to determine and will not assist any person in deciding which investment product to buy or sell, or when to buy or sell an investment product. UOBAM does not warrant the accuracy, adequacy, timeliness or completeness of the information herein for any particular purpose, and expressly disclaims liability for any error, inaccuracy or omission. Any opinion, projection and other forward-looking statement regarding future events or performance of, including but not limited to, countries, markets or companies is not necessarily indicative of, and may differ from actual events or results. Nothing in this publication constitutes accounting, legal, regulatory, tax or other advice. The information herein has no regard to the specific objectives, financial situation and particular needs of any specific person.You may wish to seek advice from a professional or an independent financial adviser about the issues discussed herein or before investing in any investment or insurance product. Should you choose not to seek such advice, you should consider carefully whether the investment or insurance product in question is suitable for you.
UOB Asset Management Ltd. Company Reg. No. 198600120Z