

Having rallied strongly this year, many investors are wondering whether the tech sector is running out of steam
Global tech stocks have performed beyond expectations this year, with the MSCI World Information Technology (IT) index surging 31 percent year to date, versus a 12 percent gain for the broader equities (MSCI World) index1.
However, there is growing concern that the tech sector’s advance may be sputtering. The MSCI World IT index has pulled back over the past weeks amid various pressures faced by its top constituents and the Federal Reserve’s latest policy actions.
Oracle for instance, saw its share price fall 12 percent after it reported revenue that fell short of what analysts expected. Apple shares also edged lower after the company unveiled its latest iPhone models but kept prices mostly unchanged.
Figure 1: Performance of MSCI World IT index vs MSCI World index
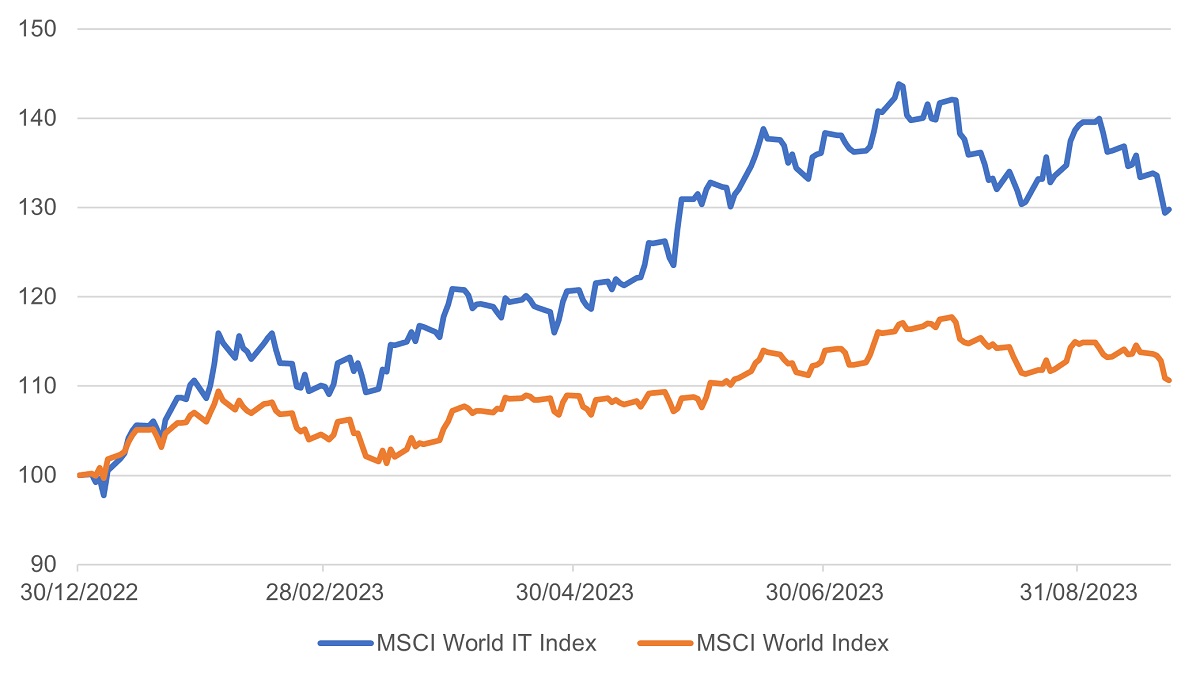
Source: Bloomberg, 30 Dec 2022 - 25 Sep 2023
Meanwhile, the Fed has signalled the prospect of higher for longer interest rates as officials increasingly believe that they can return inflation to target levels without triggering a severe recession. Higher rates are typically a headwind for tech companies as it results in a heavier discounting of their projected future cash flows, thereby reducing stock market valuations.
Can the global tech rally continue?
Given the steep run up in tech stocks over the past months, some investors think the rally looks overblown. However, we see three key reasons for continued industry strength:
1. Current valuations are not unreasonable
After a brutal 2022 where global tech stocks slumped 31 percent, the MSCI World IT index has just been playing catch up. The impressive rally – from a low base – is not necessarily a bearish sign.
Figure 2: MSCI World IT index, 2021 – 2023
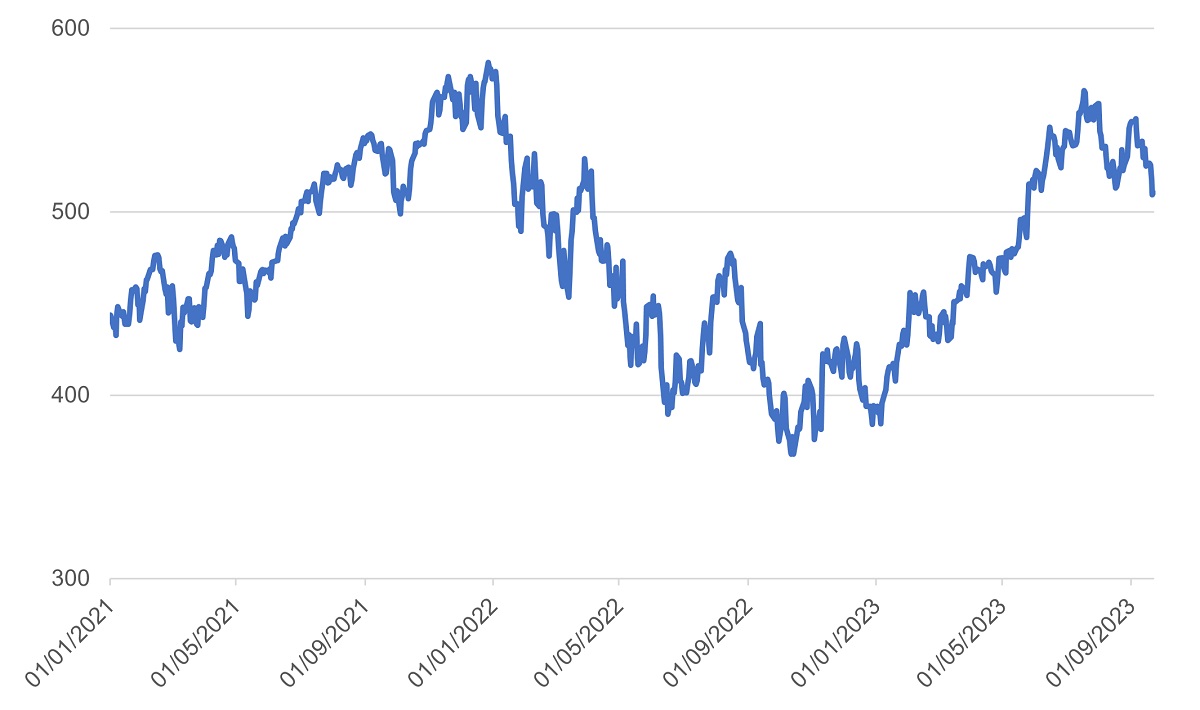
Source: Bloomberg, 1 Jan 2021 - 25 Sep 2023
At around 22 times, the average price-to-earnings ratio of the index today is also below the levels reached in 20212, and significantly below the 80 times that global tech companies peaked at during the tech bubble of 20003.
And while it is true that the global tech sector is more richly valued compared to the broader market, this has been grounded in fundamentals as reflected in the higher return on equity and profit margin of the MSCI World IT index.
Figure 3: Index comparison, 12 months ending 25 Sep 2023
| MSCI World IT Index | MSCI World Index | |
| Profit Margin | 20.2 | 11.5 |
| Return on Equity | 23.6 | 14.4 |
| Return on Assets | 10.5 | 2.3 |
Source: Bloomberg
2. Tech earnings are improving
Despite a sharp rise in interest rates over the last year, tech earnings have been surprisingly resilient. 91 percent of US IT companies reported earnings above estimates in Q2 20234. As a result, many companies are starting to revise earnings estimates upwards. Since 30 June 2023, the year-over-year earnings growth rate for the IT sector has increased to 4.2 percent from 0.4 percent5.
A key driver has been tech companies’ aggressive cost-cutting measures ranging from layoffs to tighter spending, which have helped improve margins.
The resilience of the global economy so far, leading to receding recession concerns, also bodes well for further margin expansion, setting the stage for continued earnings growth in the months ahead.
3. AI is poised to be a long-term driver
Since the launch of ChatGPT in late 2022, interest in artificial intelligence (AI) has exploded. Companies are jumping on the bandwagon, with Factset research showing the highest number of S&P 500 companies citing “AI” on their Q2 earnings calls in over a decade.
As more companies seek to incorporate AI into a wide range of products and services, they are starting to invest in AI-centric systems, including software, hardware, and services for these systems. Global AI spending is expected to reach $154 billion in 2023 and jump to more than $300 billion in 20266.
Tech companies with AI exposure stand to benefit from this rise in AI spending, with Nvidia a clear example. In its recent earnings report, the company guided for revenue this quarter to jump 170 percent on the back of strong AI infrastructure spending.
AI adoption is only going to accelerate from here. This positions AI as a strong, long-term driver for the tech industry.
AI - a driver of tech opportunities
UOBAM’s partner, T.Rowe Price, who closely monitors global tech companies, believes that the AI theme has the potential to impact companies across the entire technology supply chain, and not just the megacap tech names. Amid growing demand for AI technologies, companies in the semiconductor and cloud infrastructure space are seeing brisk revenue growth. T. Rowe Price analysts also see opportunities for tech companies selling services that enable AI proliferation.
In the tech software subsector, companies with sound business models – highly recurring revenues and scalable products – look promising as well. Within the consumer internet subsector, firms that can continue to leverage robust e-commerce demand trends and show operational efficiency offer attractive growth potential.
Although investors are most familiar with the so-called Magnificent Seven stocks (Apple, Amazon, Google, Meta, Microsoft, Nvidia, and Tesla), the firm believes that tech investment opportunities can be found across various market cap ranges, subsectors, and geographies. Examples include database solutions firm MongoDB, e-commerce platform Shopify, and software maker Adobe, whose generative AI product developments have earned positive reviews7.
Near-term risks
While there are reasons to be optimistic about global tech stocks over the longer term, the sector could come under pressure in the short term as markets adjust their interest rate expectations.
Prior to the Fed’s September meeting, investors had been expecting significant interest rate cuts in 2024. Given the solid economy and still strong jobs market however, Fed officials now project just two cuts next year, down from four indicated during their policy meeting in June.
Although economic resilience is positive for equities over the longer term, higher for longer rates could dampen near-term enthusiasm for tech stocks, which have rallied so far on expectations that the Fed was near the end of its rate-hike cycle.
1Source: Bloomberg, as of 25 Sep 2023
2Source: Bloomberg, as of 19 Sep 2023, based on 24 month forward P/E
3Source: McKinsey, The tech bubble puzzle, 5 May 2016
4Source: Factset, 8 Sep 2023
5Source: Factset, 8 Sep 2023
6IDC, “Worldwide Spending on AI-Centric Systems Forecast to Reach $154 Billion in 2023, According to IDC”, 7 March 2023
7Source: T. Rowe Price, Quarterly Review, as of 30 June 2023
If you are interested in investment opportunities related to the theme covered in this article, here are two UOB Asset Management Funds to consider:
|
MSCI Data are exclusive property of MSCI. MSCI Data are provided "as is", MSCI bears no liability for or in connection with MSCI Data. MSCI full disclaimer here.
This publication shall not be copied or disseminated, or relied upon by any person for whatever purpose. The information herein is given on a general basis without obligation and is strictly for information only. This publication is not an offer, solicitation, recommendation or advice to buy or sell any investment product, including any collective investment schemes or shares of companies mentioned within. Although every reasonable care has been taken to ensure the accuracy and objectivity of the information contained in this publication, UOB Asset Management Ltd (“UOBAM”) and its employees shall not be held liable for any error, inaccuracy and/or omission, howsoever caused, or for any decision or action taken based on views expressed or information in this publication. The information contained in this publication, including any data, projections and underlying assumptions are based upon certain assumptions, management forecasts and analysis of information available and reflects prevailing conditions and our views as of the date of this publication, all of which are subject to change at any time without notice. Please note that the graphs, charts, formulae or other devices set out or referred to in this document cannot, in and of itself, be used to determine and will not assist any person in deciding which investment product to buy or sell, or when to buy or sell an investment product. UOBAM does not warrant the accuracy, adequacy, timeliness or completeness of the information herein for any particular purpose, and expressly disclaims liability for any error, inaccuracy or omission. Any opinion, projection and other forward-looking statement regarding future events or performance of, including but not limited to, countries, markets or companies is not necessarily indicative of, and may differ from actual events or results. Nothing in this publication constitutes accounting, legal, regulatory, tax or other advice. The information herein has no regard to the specific objectives, financial situation and particular needs of any specific person.You may wish to seek advice from a professional or an independent financial adviser about the issues discussed herein or before investing in any investment or insurance product. Should you choose not to seek such advice, you should consider carefully whether the investment or insurance product in question is suitable for you.
This publication has not been reviewed by the Monetary Authority of Singapore.
UOB Asset Management Ltd. Company Reg. No. 198600120Z