
Asian REITs are back on track
The last decade has seen an aggressive expansion of Asian real estate markets, despite the Covid blip
It’s hard not to notice that rents are rising across Asia. If you are a condominium owner, it has probably caught your attention that rents have trended up steadily over the past 18 months. Singapore public housing (Housing Development Board) rents have also increased every month over the past two years. Both are now around 20 percent higher than they were a year ago1.
As a result, real estate investment trusts (REITs) markets have been rebounding. This is despite the worldwide correction in REITs markets caused by the Covid-19 pandemic. With work-from-home and an explosion of e-commerce trends, the global REITs market, represented by The FTSE EPRA NAREIT Index, dropped over 30 percent2 during the peak of the pandemic, with most REITs sectors suffering big losses in 2020.
Since then, however, many REITs markets have returned to pre-pandemic levels. This not only applies to markets in the US - currently the largest player in the global REITs market – but also to non-U.S. REITs markets, most notably in Asia. From 2013 to 2021, and despite the Covid crisis, the market capitalisation of the three largest REITs markets in Asia i.e. Hong Kong, Japan and Singapore have increased by 79 percent3
Figure 1: Growth in Global REITs, Sep 2013 - Sep 2021
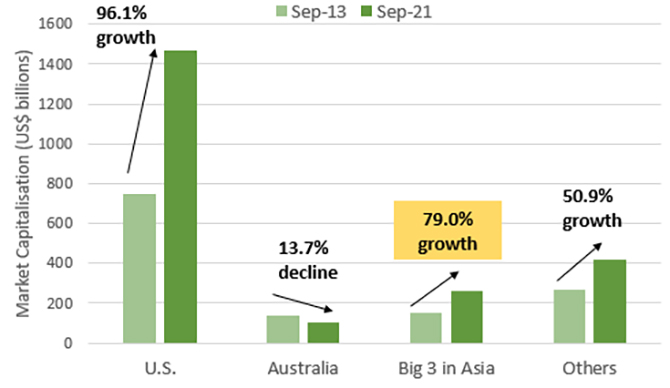
Source: EPRA, Hong Kong Financial Services Development Council (FSDC), Deloitte, November 2021.
Aside from REITs pioneers in the region, relatively younger markets have also joined the scene and are showing good promise. Countries like India, China, Thailand, South Korea and the Philippines are expected to grow their REITs over the coming years, and together make up about 40 percent of Asia’s total REITs market value of US$416 billion3 (as of September 2021).
Rising rents, a boost for Asian REITs
In Asia, various REITs sectors are poised to benefit from rising rental rates. Besides the buoyant rents in Singapore’s residential sector, residential rents in Australia are also up strongly - 9.8 percent in the past 12 months to July, the highest in more than 12 years4.
Singapore’s retail sector rents are also moving up at a slower but steadier pace. According to JLL’s retail property outlook5, rents for prime retail floor space are expected to gain 2.5 to 3.5 percent per annum over the next five years. This sector, particularly the centrally-located properties, are prime beneficiaries of the region’s gradual Covid re-opening.
Industrial properties have also witnessed positive rent growth across all asset types, including factories and warehouses. This sector in Asia has also seen unprecedented growth in the e-commerce space and new-found investor interest in alternative property types such as logistic and data centres6. As a result, industrial REITs returns grew by 24.7 percent in 2021, 16.4 percent on a 10-year annualised basis6 – the highest of any asset class.
S-REITs help lead the charge in Asia
Despite being a small country, Singapore is the second largest REITs market in Asia after Japan. The Singapore REITs (S-REITs) market cap has been growing at a rate of 13 percent per annum for the last ten years, reaching S$110 billion in June 2022. It makes up 13 percent of the Singapore Exchange’s (SGX) market capitalisation a sign of the sector’s importance to the Singapore market.
While neighbouring countries are growing their REITs markets, the S-REITs market continues to benefit from a strong governance and regulatory framework and diverse offerings. This has enabled S-REITs to be one of the first Asian REITs markets to recover from the Covid downturn, with a positive return of 1.00 percent year-to-date (see Fig. 2). Amid rising interest rates, other Asia Pacific REITs markets are slower to normalise, although these are still performing better than Asia Pacific equities. Select Asian sectors such as retail and industrials are expected to continue to strengthen over the medium term.
Figure 2: Performance of REIT markets year-to-date, 2022
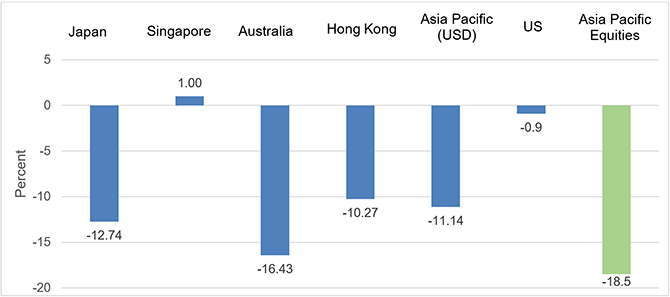
Source: Bloomberg, UOBAM as at 17 Aug 2022
Note: Japan REITs - TSE REIT Index | SG REITs - FTSE ST REIT Index | Australia REITs - S&P/ASX 200 A-REIT Index | HK REITs - Hang Seng REIT Index | Asia-Pacific REITs (USD) - S&P APAC REIT (USD) Index | US REITs - FTSE E/N All Equity Reit Index | AP Equities - MSCI AC Asia Pac Index
Asian REITs offer portfolio diversification
REITs investments are often favoured for their income potential. They are in effect a pool of real estate assets that generate revenue by collecting rent, and about 90 percent of the profit is then paid out to investors on a regular basis7. So regardless of fluctuating capital values, REITs remain attractive as a source of extra income, especially when inflation is causing the cost of everyday items to rise.
What is less well recognised is that REITs have a relatively low correlation to other asset classes. This means that whatever direction bond or equity markets take, REITs will tend not to follow closely, making it a good hedging and diversification tool. In the case of Asia Pacific REITs markets, the 0.5 number below indicates only a moderate correlation with global equities, and even weaker correlation with Asian equities and Asian bonds.
Figure 3: Correlation of major asset classes with Asia Pacific REITs
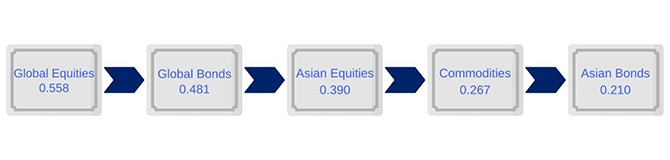
Source: UOBAM/Bloomberg, as at 31 Mar 2022, based on data from the past 10 years
Note: A correlation coefficient of 1 means that there is a perfect positive correlation between the two assets ie they can be expected to move exactly in tandem. A zero correlation coefficient implies that there is no linear relationship at all.
Green buildings are becoming more popular in Asia
Alongside the growth of the real estate sector in Asia has come a serious environmental impact. The United Nations (UN) notes that buildings account for 37 percent of the world’s annual greenhouse gas emissions and consumes around 36 per cent of the world’s energy8.
This has increased the pressure on real estate companies in Asia to move faster to reduce their carbon emissions. Developers are fast realising that green buildings not only contribute to the battle against global warming, but is of growing appeal to tenants, consumers and investors.
The International Finance Corporation (IFC), a member of the World Bank Group, estimates that by 2030, over 70 percent of the US$24.7 trillion business opportunity in the emerging market green buildings sector lies in Asia9. This is because over the next decade, more than half of the world’s urban population will be living in Asia, with a substantial portion enjoying higher levels of affluence. And while green building are more expensive to build, this is more than compensated for by the decrease in operational costs, and the rise in sales premiums, occupancy rates and rental incomes.
REITs opportunities offered by UOBAM
For those looking to gain exposure to Asian REITs, UOBAM offers two solutions to consider, the UOB APAC Green REIT ETF and the United Asia Pacific Real Estate Income Fund.
| UOB APAC Green REIT ETF (as of Aug 2022) |
United Asia Pacific Real Estate Income Fund (as of Aug 2022) |
||
| Investment Objective | To provide investment results that, before fees, costs and expenses (including any taxes and withholding taxes), closely correspond to the performance of the iEdge-UOB APAC Yield Focus Green REIT Index | To seek total return consisting of income and capital appreciation over the medium to long term by investing primarily in Real Estate Investment Trusts (“REITs”) listed in the Asia Pacific region (including Japan, Australia and New Zealand) | |
| Geographical Allocation | Autralia | 38.32% | 28.67% |
| Japan | 39.40% | 28.37% | |
| Singapore | 12.37% | 24.63% | |
| Hong Kong | 7.38% | 10.84% | |
| China | - | 2.47% | |
| Philippines | - | 1.20% | |
| Cash | 2.53% | 3.83% | |
| Sector Allocation | Retail REITs – 32.68% Diversified REITs – 28.99% Industrial REITs – 7.72% Office REITs – 25.50% Residential REITs – 1.42% Specialised REITs – 1.16% Cash – 2.53% |
Retail REITs – 25.15% Diversified REITs – 18.31% Diversified Real Estate Activities – 13.09% Industrial REITs – 12.62% Real Estate Development – 7.60% Office REITs – 5.04% Specialised REITs – 4.33% Hotel & Resort REITs – 3.88% Others – 6.15% Cash – 3.83% |
|
| Top 10 Holdings | Link REIT – 6.70% Scentre Group – 6.54% Nippon Building Fund Inc – 6.11% Dexus – 6.08% Vicinity Centres – 5.68% GPT Group/The – 5.42% Mirvac Group – 5.31% Stockland – 5.18% Japan Real Estate Investment Corporation – 4.17% Japan Metropolitan Fund Invest – 3.99% |
Goodman Group – 6.10% Link REIT – 5.09% Capitaland Integrated Commercial Trust – 4.29% Misui Fudosan Co Ltd – 4.26% Mitsubishi Estate Co Ltd – 3.88% Scentre Group – 3.86% Capitaland Investment Ltd/Singapore – 2.94% Mirvac Group – 2.85% CK Asset Holdings Ltd – 2.64% China Overseas Land & Investment Ltd – 2.49% |
|
| Distribution Frequency | Quarterly (Distributions are not guaranteed) | Monthly (Distributions are not guaranteed) | |
| Management Fee | Currently 0.45% p.a., maximum 2% p.a. | Currently 1.5% p.a., maximum 2% p.a. | |
| Benchmark Index | iEdge-UOB APAC Yield Focus Green REIT Index | S&P Asia Pacific REITs Index |
For more information, important notes and disclaimers on the above funds, please refer to the respective fund information:
United Asia Pacific Real Estate Income Fund
References:
1The Business Times, “Residential property rentals expected to remain elevated this year after uptick in June”, July 2022.
2Econbiz, “How Resilient Are REITs to a Pandemic? The COVID-19 effect”, July 2020.
3Deloitte, “Towards Greater Heights – Singapore Remains Competitive Against Emerging Asian REIT Markets”, November 2021.
4ABC News, “Even with a historic fall in house prices, rents are tipped to rise by as much as 10 per cent. Will they ever go down?”, August 2022.
5JLL Research, “Singapore retail property market outlook 2022-2026”, August 2022.
6Cushman & Wakefield, “Industrial REITs well positioned for long-term growth”, June 2022.
7Nareit, “What’s a REIT (Real Estate Investment Trust)?”, September 2022.
8UN Environment Programme, “2021 Global Status Report for Buildings and Construction”, October 2021.
9International Finance Corporation, “Green Buildings: A Financial and Policy Blueprint for Emerging Markets”, 2019.
This publication shall not be copied or disseminated, or relied upon by any person for whatever purpose. The information herein is given on a general basis without obligation and is strictly for information only. This publication is not an offer, solicitation, recommendation or advice to buy or sell any investment product, including any collective investment schemes or shares of companies mentioned within. Although every reasonable care has been taken to ensure the accuracy and objectivity of the information contained in this publication, UOB Asset Management Ltd (“UOBAM”) and its employees shall not be held liable for any error, inaccuracy and/or omission, howsoever caused, or for any decision or action taken based on views expressed or information in this publication. The information contained in this publication, including any data, projections and underlying assumptions are based upon certain assumptions, management forecasts and analysis of information available and reflects prevailing conditions and our views as of the date of this publication, all of which are subject to change at any time without notice. Please note that the graphs, charts, formulae or other devices set out or referred to in this document cannot, in and of itself, be used to determine and will not assist any person in deciding which investment product to buy or sell, or when to buy or sell an investment product. UOBAM does not warrant the accuracy, adequacy, timeliness or completeness of the information herein for any particular purpose, and expressly disclaims liability for any error, inaccuracy or omission. Any opinion, projection and other forward-looking statement regarding future events or performance of, including but not limited to, countries, markets or companies is not necessarily indicative of, and may differ from actual events or results. Nothing in this publication constitutes accounting, legal, regulatory, tax or other advice. The information herein has no regard to the specific objectives, financial situation and particular needs of any specific person. You may wish to seek advice from a professional or an independent financial adviser about the issues discussed herein or before investing in any investment or insurance product. Should you choose not to seek such advice, you should consider carefully whether the investment or insurance product in question is suitable for you.
This advertisement has not been reviewed by the Monetary Authority of Singapore.
UOB Asset Management Ltd. Company Reg. No. 198600120Z