

With Nvidia stocks up an astounding 1,240 percent over the past five years, the current AI boom is displaying signs of “irrational exuberance”. So it is important to learn from history and ask: are we in an AI bubble and how close are we to the end?

Anthony Raza, Head of Multi-Asset Strategy
Learning from history
In terms of tech-driven investor excitement, the 2020s has all the hallmarks of the 1990s. Back then, investors couldn’t get enough of internet stocks and from 1995 – 2000, drove the NASDAQ Composite index up by over 400 percent.
Notably, the market remained buoyant even after warnings about overstretched valuations from the then-Fed chair, Alan Greenspan. In fact, the bubble only burst three years later in March 2000, but by September 2002, almost 80 percent of earlier gains had been wiped out.
The rally in AI stocks is starting to show similar frothiness. Although we have not seen the extremes of the 1990s, with NASDAQ (only!) doubling over the past five years, the rally remains highly concentrated in megacap stocks like the Magnificent Seven and Nvidia in particular. As a result, the Bloomberg Magnificent Seven Index has risen by close to 300 percent over the same period.
6 stages of the bubble cycle
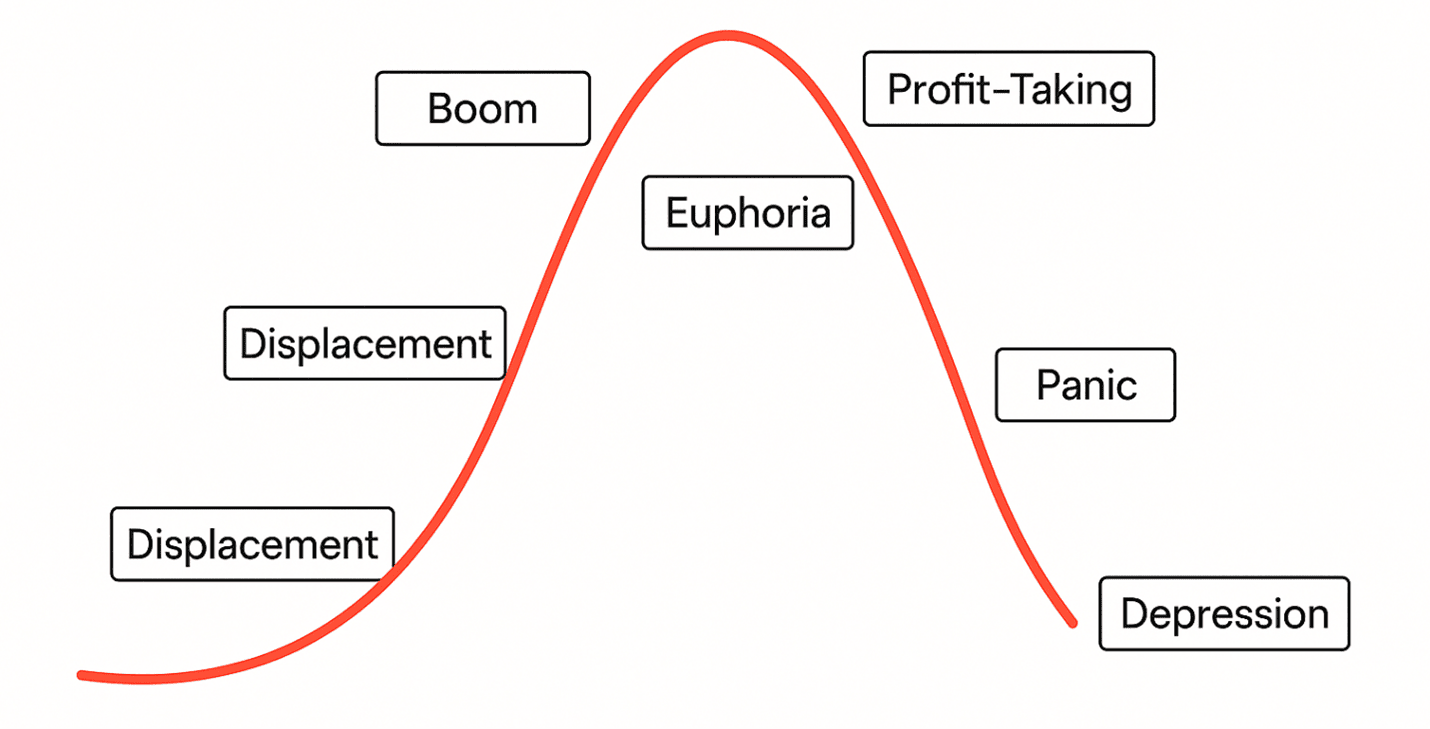
So how can we assess whether we are in an AI bubble, and if so, how long can this bubble last? One way is to look at how bubbles develop. Lessons from the 1990s tell us that there are typically six stages:
1. Displacement – when a new innovation starts to capture investors’ attention
2. Boom – when stock prices start to rise steadily, but fundamentals still support valuations
3. Euphoria – when prices start to accelerate, valuations appear expensive and buying becomes driven by FOMO (Fear of Missing Out)
4. Profit-taking – when some selling starts to appear and volatility increases. But the majority of investors remain overly-optimistic
5. Panic – when confidence is finally eroded and forced selling causes prices to drop rapidly.
6. Depression – when market valuations eventually return to their historical average.
Fig 1: Stages of a bubble cycle
Profit taking could become more entrenched
There are several reasons to worry that the current rally is past the “euphoria” and entering the “profit taking” stage. As we saw at the start of 2025, when DeepSeek launched their groundbreaking AI model and President Trump announced global trade tariffs, drawdowns of 10 percent or more among AI-related stocks have become more frequent.
At the same time, AI stocks now account for about 44 percent of the S&P 500 capitalisation and many more stocks are AI-related. As a result, the overall US stock market is looking significantly overvalued. The 12-month forward price to earnings (P/E) ratio is currently at two standard deviations above its long-term average. Other measures such as the price to book (P/B) ratio and the PE Buffett Indicator, which is the ratio of the US’s stock market value to GDP, both show more than two standard deviations above the long term average. Historically, only 5 percent of valuation datapoints have ever reached this level.
Meanwhile, some other US market indicators are less than encouraging. US individuals are already heavily invested. The US’s equity positioning, especially among retail investors, is at a five-year high. This means the risk of investment redemptions is high relative to the risk of investment deepening. As a result, the short term outlook for returns remains uncertain and market volatility looks likely to rise.
But is it too early to jump ship?
That said, the 1990s proved that the profit taking stage can last several years before panic sets in. There are no immediate economic catalysts on the horizon that have the potential to trigger a major correction.
Analysts remain optimistic that a recession can be avoided next year, especially now that the Fed has re-started its easing programme. The usual economic leading indicators such as retail sales, jobless claims and bank liquidity are not signalling an imminent recession. Furthermore, earning growth projections for US companies, at 11 percent for 2025 and 13.4 percent for 2026 are also not a cause for concern.
It appears to us therefore that while there is no short term threat of a drastic fall in asset prices, AI capabilities will have to ramp up quickly from here if current sky-high valuations do not appear wholly unsustainable. AI companies and consulting firms like McKinsey have predicted that trillion of dollars will be needed for energy infrastructure and model training over the next five years. This level of capital expenditure will likely no longer derive from companies’ free cash flows but from borrowings. As such, these investments will need to demonstrate their transformational impact sooner rather than later, and not just in the US but around the world.
Stay neutral and “close to the door”
As detailed in our 4Q 2025 Investment Strategy Report, we recommend investors continue to take a neutral position across most asset classes. We would stress that this neutrality is strategic, rather than reflecting a lack of conviction.
Given that we expect markets to remain positive but accompanied by more and deeper drawdowns, we believe a diversified approach is the most resilient approach and offers the best chance of achieving positive returns amid more market volatility.
Within equities, we suggest taking a more defensive stance by including financial sector and smaller cap stocks. Regionally, we expect stronger relative performance in the Asia ex Japan equity markets where we see better valuations, stronger currency trends and a growing domestic consumer base.
Under profit-taking pressures, a well-balanced allocation to safe-haven assets can also help cushion short term equity market declines. Bond yields are currently attractive, and potential interest rate cuts to restore growth will help generate capital gains. Historically, we have leaned heavily on long-dated US Treasuries in such environments. However, given today’s broader range of risks, we recommend a more diversified safe-haven strategy that includes a mix of long and short-dated US Treasuries, gold, German Bunds, and Treasury Inflation-Protected Securities (TIPS).
| If you are interested in investment opportunities related to the theme covered in this article, here is a UOB Asset Management Fund to consider: United Global Durable Equities Fund
You may wish to seek advice from a financial adviser before making a commitment to invest in the above fund, and in the event that you choose not to do so, you should consider carefully whether the fund is suitable for you. |
All information in this publication is based upon certain assumptions and analysis of information available as at the date of the publication and reflects prevailing conditions and UOB Asset Management Ltd (“UOBAM”)'s views as of such date, all of which are subject to change at any time without notice. Although care has been taken to ensure the accuracy of information contained in this publication, UOBAM makes no representation or warranty of any kind, express, implied or statutory, and shall not be responsible or liable for the accuracy or completeness of the information.
Potential investors should read the prospectus of the fund(s) (the “Fund(s)”) which is available and may be obtained from UOBAM or any of its appointed distributors, before deciding whether to subscribe for or purchase units in the Fund(s). Returns on the units are not guaranteed. The value of the units and the income from them, if any, may fall as well as rise, and is likely to have high volatility due to the investment policies and/or portfolio management techniques employed by the Fund(s).
Please note that the graphs, charts, formulae or other devices set out or referred to in this document cannot, in and of itself, be used to determine and will not assist any person in deciding which investment product to buy or sell, or when to buy or sell an investment product. An investment in the Fund(s) is subject to investment risks and foreign exchange risks, including the possible loss of the principal amount invested. Investors should consider carefully the risks of investing in the Fund(s) and may wish to seek advice from a financial adviser before making a commitment to invest in the Fund(s). Should you choose not to seek advice from a financial adviser, you should consider carefully whether the Fund(s) is suitable for you. Investors should note that the past performance of any investment product, manager, company, entity or UOBAM mentioned in this publication, and any prediction, projection or forecast on the economy, stock market, bond market or the economic trends of the markets is not necessarily indicative of the future or likely performance of any investment product, manager, company, entity or UOBAM or the economy, stock market, bond market or economic trends of the markets. Nothing in this publication shall constitute a continuing representation or give rise to any implication that there has not been or that there will not be any change affecting the Funds. All subscription for the units in the Fund(s) must be made on the application forms accompanying the prospectus of that fund.
The above information is strictly for general information only and is not an offer, solicitation advice or recommendation to buy or sell any investment product or invest in any company. This publication should not be construed as accounting, legal, regulatory, tax, financial or other advice. Investments in unit trusts are not obligations of, deposits in, or guaranteed or insured by United Overseas Bank Limited, UOBAM, or any of their subsidiary, associate or affiliate or their distributors. The Fund(s) may use or invest in financial derivative instruments and you should be aware of the risks associated with investments in financial derivative instruments which are described in the Fund(s)’ prospectus.
This advertisement has not been reviewed by the Monetary Authority of Singapore.
UOB Asset Management Ltd Co. Reg. No. 198600120Z