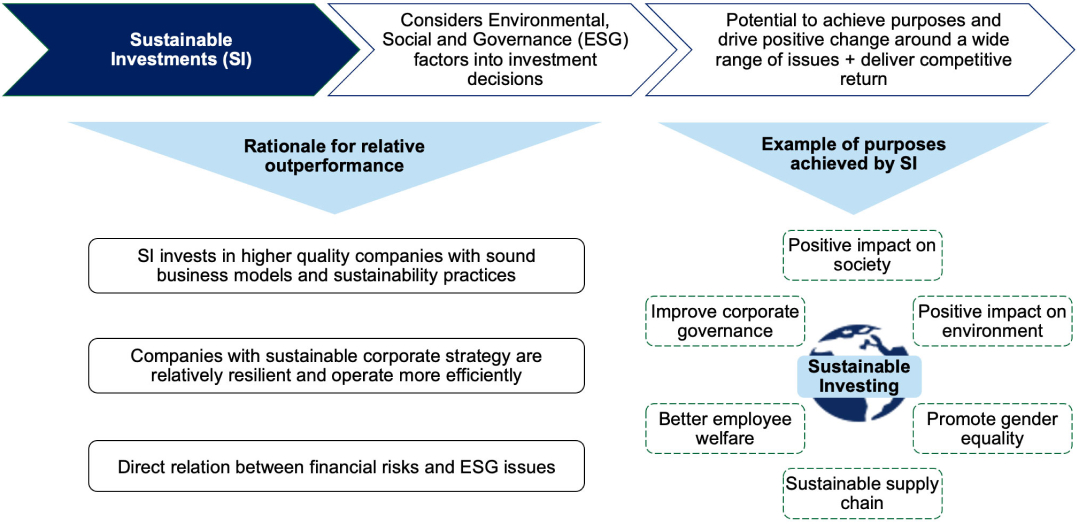
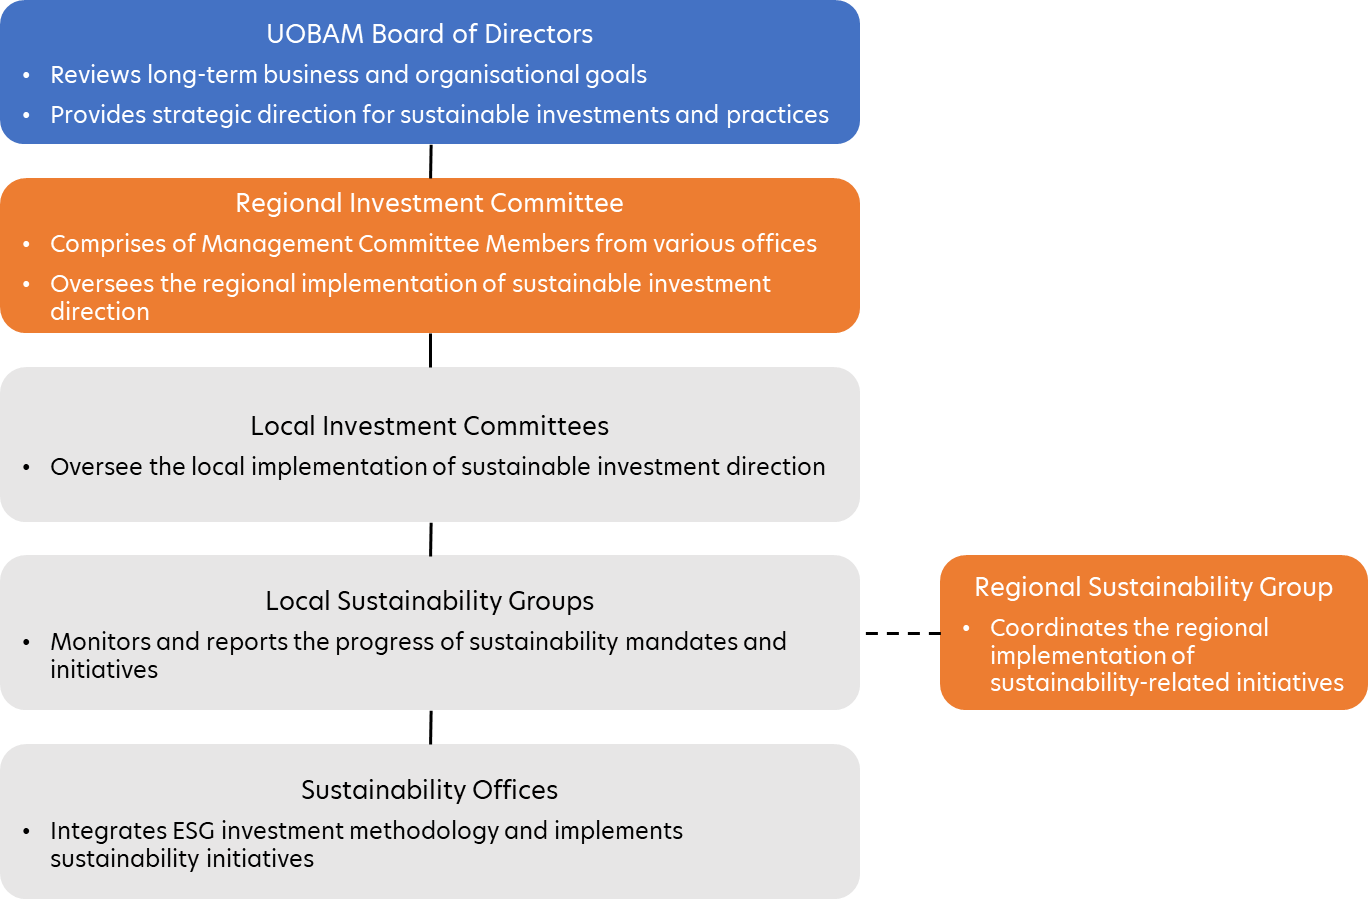
Below is an overview of how ESG is incorporated into our investment process
Identification of material ESG factors
The process of ESG evaluation begins firstly with the assessment of material ESG factors of companies which is determined by a materiality map.
The materiality map is developed by referencing the Sustainability Accounting and Standards Board ("SASB") materiality map. This materiality map also assigns specific E, S and G pillar weights to companies across 11 sectors that are classified using Global Industry Classification Standard ("GICS").
Identification of material ESG factors
The process of ESG evaluation begins firstly with the assessment of material ESG factors of companies which is determined by a materiality map.
The materiality map is developed by referencing the Sustainability Accounting and Standards Board ("SASB") materiality map (see Appendix 4 for information on the SASB). This materiality map also assigns specific E, S and G pillar weights to companies across 11 sectors that are classified using Global Industry Classification Standard ("GICS").
Formulation of ESG score
Following the identification of relevant material E, S and G issues with their respective E, S and G pillar weights, ESG scores are formulated based on third party data provided by vendors such as MSCI. Adjustments are then made by country and sector for relative comparison.
In order to make the scores comparable across sectors and countries, and for a company’s ESG score and practices to be made comparable against its peers, adjustments are made through normalisation methodology.
Although the key features of these third-party data sources include their high issuer coverage and wide market acknowledgement, we complement this through independent ESG analysis and research by our various ESG analysts and investment professionals across regional offices. In the absence of complete ESG data coverage by vendors, ESG manual scoring is conducted by our ESG analysts and investment professionals. Analysts will gather information according to the materiality map and ESG scoring guidelines and assess a company’s risk and management of environmental, social and governance issues.
UOBAM ESG Controversy Alert System
In addition, the ESG scores are supplemented by our ESG Controversy Alert System which is an artificial intelligence machine learning model that combs through news reports daily and assigns controversy scores.
ESG data typically originates from Sustainability Reports, Integrated Reports and Task Force on Climate-related Financial Disclosure Reports published by companies. These reports are infrequent and typically published annually. Hence, such ESG data are infrequent, static, point-in-time data and typically backwards-looking.
Incorporation of ESG controversy alert system aims to include dynamic ESG data.
UOBAM ESG Rating scale
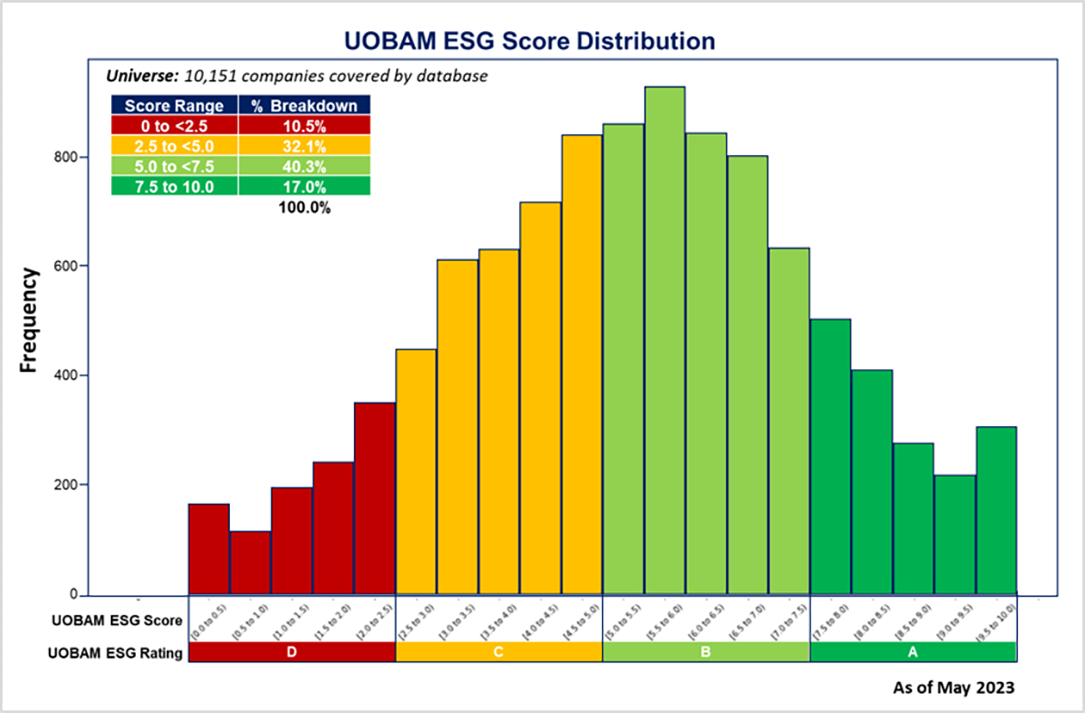
The final adjusted ESG Score will be mapped to a letter rating as follow:
| Letter Rating |
Final Adjusted ESG Score |
Definition |
| A |
7.5 to 10.0 |
Very strong ESG performance and practices (ESG Leaders) |
| B |
5.0 to below 7.5 |
Above average ESG performance and practices (Potential ESG Leaders) |
| C |
2.5 to below 5.0 |
Below average ESG performance and practices |
| D |
0.0 to below 2.5 |
Very weak ESG performance and practices |
Based on the coverage universe of 10,151 companies, we have obtained an UOBAM ESG Score distribution as follows:


