UOB bank


The US second quarter GDP saw growth contracting by 32.9% which was the sharpest quarterly decline on record since data were made available in 1947. The previous record was a 10% decline in 1Q 1958.
The worst of the 2Q contraction was in April when economic activities ground to a halt as lockdown measures to contain the coronavirus (COVID-19) from social distancing, travel restrictions, “stay-home orders” and border closures exacted a heavy toll. Private consumption expenditure bore the brunt of the drastic decline while the dips in business and residential investments added to the shrinkage. Business spending had plummeted at a faster decline of -27% from - 6.7% in 1Q. Residential investments also dived by -38.7% in 2Q after three strong quarters of growth.
Positives
The positives were from government fiscal stimulus and net exports which helped cushion the 2Q growth destruction. The biggest contributor to seasonally adjusted annualized rate (SAAR) GDP or headline GDP had come from federal spending which surged 39.7% as government pandemic assistance payments were distributed to households and businesses. Net exports of goods and services added 0.68 percentage points to the change in headline GDP even though exports fell 64.1%. The positive contribution was due to the bigger offset from imports which recorded a smaller decline (-53.4%) versus that of exports.
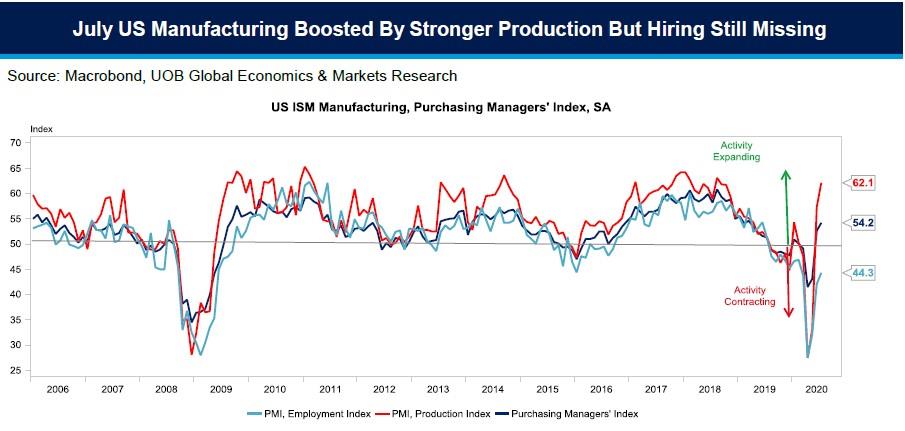
US manufacturing entered the third quarter on a firmer footing as the Institute for Supply Management’s (ISM) manufacturing Purchasing Managers' Index (PMI) rose to 54.2 for July, up from 52.6 in June. A reading above 50 means overall expansion in activity and conversely, a below 50 points to an overall contraction in activity. This was the strongest reading since March 2019 and marked two straight months of expansion.
But while the employment measure edged higher, it was still below the 50 mark at 44.3 (from 42.1 in June; pandemic low was at 27.5 in April) suggesting that the improvements in production and orders at 61.5 in July are not generating more jobs.
Outlook
If the pandemic continues at its current pace or even worsens, it may potentially mean a repeat of some of the draconian measures to contain it which will further dent the labor market. The US had lost a staggering 22.16 million jobs in March and April. Even with the sterling gains for May and June, total non-farm employment is still 14.7 million or 9.6% lower than in February. The COVID-19 situation could derail any near-term jobs recovery and hence consumer spending especially for in 3Q if there is no fiscal assistance as the $600 in additional weekly jobless benefits had expired on 31 July, which by some estimates add up to U$18 billion a week.
While we are still projecting a resumption of quarter-on-quarter growth in 2H 2020 on the assumption that the COVID-19 situation will improve or be partly under control by 3Q, any 2H rebound (+12.1% in 3Q and 7.4% in 4Q) will not offset the 1H contraction. Our full-year forecast is for the US GDP to contract by 5.8% vs +2.2% in 2019, which is more optimistic than the Fed forecast of - 6.5% and the -8% from the International Monetary Fund (IMF) in June.
This publication shall not be copied or disseminated, or relied upon by any person for whatever purpose. The informationherein is given on a general basis without obligation and is strictly for information only. This publication is not an offer,solicitation, recommendation or advice to buy or sell any investment product, including any collective investmentschemes or shares of companies mentioned within. Although every reasonable care has been taken to ensure theaccuracy and objectivity of the information contained in this publication, UOB Asset Management Ltd (“UOBAM”) andits employees shall not be held liable for any error, inaccuracy and/or omission, howsoever caused, or for any decisionor action taken based on views expressed or information in this publication. The information contained in this publication,including any data, projections and underlying assumptions are based upon certain assumptions, managementforecasts and analysis of information available and reflects prevailing conditions and our views as of the date of thispublication, all of which are subject to change at any time without notice. Please note that the graphs, charts, formulaeor other devices set out or referred to in this document cannot, in and of itself, be used to determine and will not assistany person in deciding which investment product to buy or sell, or when to buy or sell an investment product. UOBAMdoes not warrant the accuracy, adequacy, timeliness or completeness of the information herein for any particularpurpose, and expressly disclaims liability for any error, inaccuracy or omission. Any opinion, projection and otherforward-looking statement regarding future events or performance of, including but not limited to, countries, markets orcompanies is not necessarily indicative of, and may differ from actual events or results. Nothing in this publicationconstitutes accounting, legal, regulatory, tax or other advice. The information herein has no regard to the specificobjectives, financial situation and particular needs of any specific person. You may wish to seek advice from aprofessional or an independent financial adviser about the issues discussed herein or before investing in any investmentor insurance product. Should you choose not to seek such advice, you should consider carefully whether the investmentor insurance product in question is suitable for you.
Invest in your mind. Receive our curated insights in your inbox.
Subscribe