UOB bank


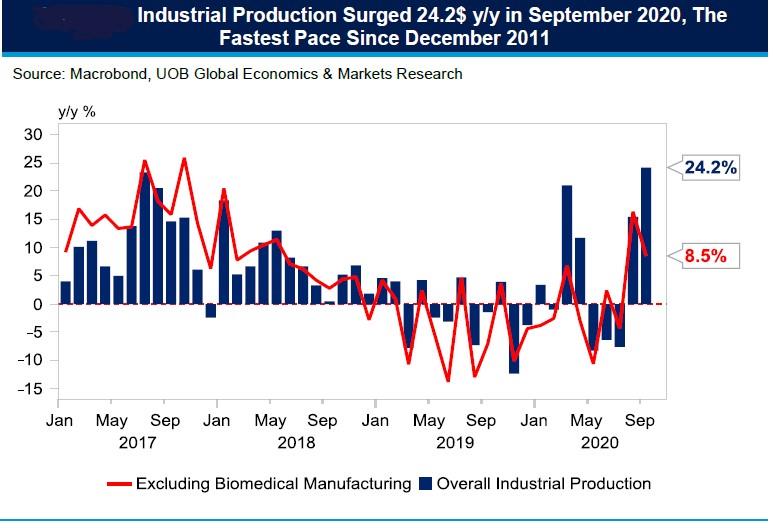
Singapore’s industrial production surprised market expectations with a 24.2% year-on-year (+10.1% month-on-month, seasonally adjusted) surge in September 2020 compared to Bloomberg expectations of 2.5% y/y (-7.8% m/m). Excluding biomedical manufacturing, industrial output grew 8.5% y/y while the August figure has been revised higher to +15.4% y/y (+15.5% m/m) from the previous print of +13.7% y/y (+13.9% m/m). With the latest data, Singapore’s manufacturing output rose 5.7% in the first three quarters of 2020, up from -0.6% for the corresponding period a year ago.
The strong industrial production performance in both August (+15.4% y/y) and September (+24.2% y/y) puts overall manufacturing cluster growth at 10.0% for the third quarter of 2020 compared to the advance estimates for 3Q20 GDP by the Ministry of Trade and Industry (MTI) at +2.0% y/y. Assuming that contractions for the construction and services sector at 28.7% y/y and 4.1% y/y respectively, this will translate to 3Q20 GDP weighing in at -5.6% y/y, which is an improvement over advance estimates at -7.0%.
The surge in manufacturing output was underpinned by the biomedical and electronic manufacturing clusters. The strong performance in the biomedical manufacturing cluster (+89.8% y/y, fastest pace in 5 months) suggests the continued demand for pharmaceutical-related products especially during the ongoing COVID-19 pandemic. Delving into the sub-components, the surge in the biomedical manufacturing cluster had come on the back of strong pharmaceutical production (+113.6% y/y), while export demand for medical instruments led overall medical technology production (+15.0% y/y).
Similar to August, the demand from cloud services, data centres and the 5G market had likely supported Singapore’s electronic cluster (+30.1% y/y). Growth in semiconductor (+37.4% y/y) and other electronic modules & components (+8.4% y/y) also lifted overall electronic production (+30.1% y/y).
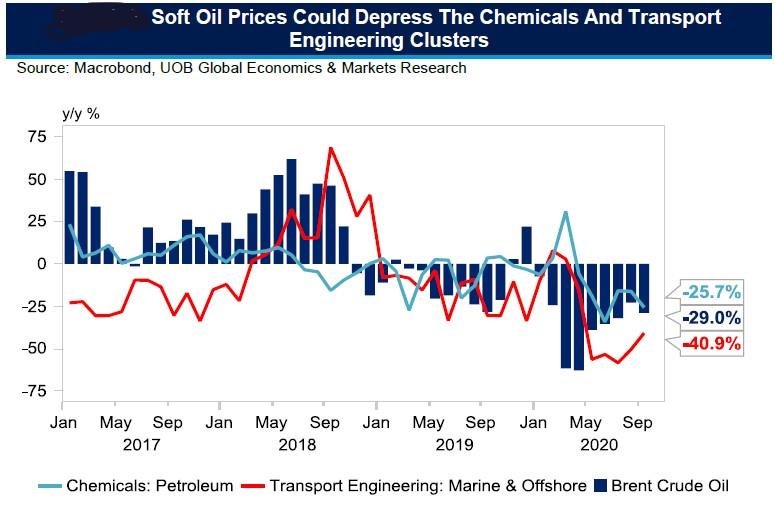
Meanwhile, low oil prices expected for the rest of 2020 will likely continue to depress the chemicals and transport engineering sectors while COVID-19 related factors may also continue to weigh on the general manufacturing cluster. According to the Economic Development Board (EDB), the pace of contraction in August output (-16.7% y/y) was “negatively affected by the slow resumption of domestic construction activities, while the fall in production seen in the miscellaneous industries (-8.0% y/y) was led by “lower demand for print jobs amid COVID-19”.
Outlook
Given the upside surprise in September’s manufacturing pace, year-to-date manufacturing growth is now on a stronger footing at +5.7% y/y, up from -0.6% y/y for the same period last year. We have raised our full-year industrial production outlook to +5.5% from +2.5% previously. Should our expectations materialise, Singapore’s GDP outlook may register a smaller contraction of 5.5% for 2020, up from our previous outlook of -6.5%.
This publication shall not be copied or disseminated, or relied upon by any person for whatever purpose. The information herein is given on a general basis without obligation and is strictly for information only. This publication is not an offer, solicitation, recommendation or advice to buy or sell any investment product, including any collective investment schemes or shares of companies mentioned within. Although every reasonable care has been taken to ensure the accuracy and objectivity of the information contained in this publication, UOB Asset Management Ltd (“UOBAM”) and its employees shall not be held liable for any error, inaccuracy and/or omission, howsoever caused, or for any decision or action taken based on views expressed or information in this publication. The information contained in this publication, including any data, projections and underlying assumptions are based upon certain assumptions, management forecasts and analysis of information available and reflects prevailing conditions and our views as of the date of this publication, all of which are subject to change at any time without notice. Please note that the graphs, charts, formulae or other devices set out or referred to in this document cannot, in and of itself, be used to determine and will not assist any person in deciding which investment product to buy or sell, or when to buy or sell an investment product. UOBAM does not warrant the accuracy, adequacy, timeliness or completeness of the information herein for any particular purpose, and expressly disclaims liability for any error, inaccuracy or omission. Any opinion, projection and other forward-looking statement regarding future events or performance of, including but not limited to, countries, markets or companies is not necessarily indicative of, and may differ from actual events or results. Nothing in this publication constitutes accounting, legal, regulatory, tax or other advice. The information herein has no regard to the specific objectives, financial situation and particular needs of any specific person. You may wish to seek advice from a professional or an independent financial adviser about the issues discussed herein or before investing in any investment or insurance product. Should you choose not to seek such advice, you should consider carefully whether the investment or insurance product in question is suitable for you.
Invest in your mind. Receive our curated insights in your inbox.
Subscribe