UOB bank


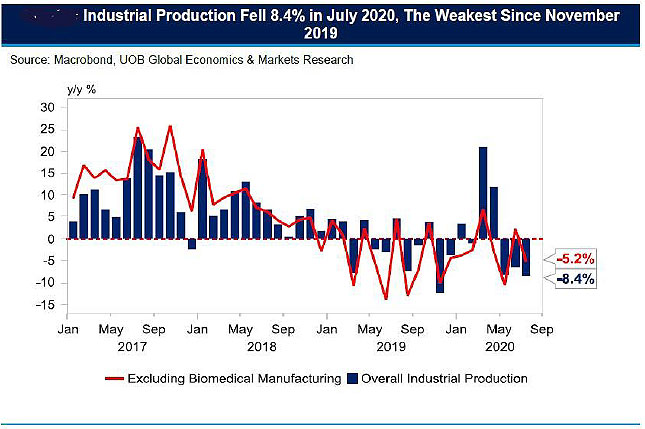
Singapore’s industrial production figures have fell short of market expectations contracting by 8.4% year-on-year (y/y) in July marking the third straight month of negative growth on-year versus market estimates of 7.0% y/y.
The surprised dip had come from a decline in biomedical output which fell 24.8% y/y and was comparatively weaker compared to 1H20 with the production index weighing in at 77.3 for July, which was the lowest since November 2019 (72.2) for the cluster versus the 1H20 average of 132.1.
The double-digit contraction in the absence of a high base for the same month a year ago suggested that other factors might have been in play such as the normalisation of biomedical production from March (+85.6% y/y) and April 2020 (+90.1% y/y) and a rise in pharmaceutical inventories which might have discouraged further production. Nonetheless, export demand for biomedical products continued to stay strong, given the 15.5% y/y expansion in July pharmaceutical exports.
What is worryingly is the overall pace of contraction which was deeper in July compared to June’s upward revision of -6.5% y/y (from -6.7%) during restrictions under Phase One of the Circuit Breaker. Other factors such as low oil prices and a relatively high base year for electronics-related production might have also contributed to the dip in July’s industrial production. Clusters such as the transport engineering (-37.4% y/y for the fourth month in a row) and chemicals (-2.4% y/y) remained weak due to low oil prices. The general manufacturing sector also fell 22.2% y/y but had likely stemmed from to a high base (July 2019: +6.1% y/y) a year ago which was also the case for the electronics cluster (July 2020: -1.4% y/y vs July 2019: +8.0% y/y).
Outlook: Industrial output to contract by 2.0% in 2020
Risks arising from weakened global trade are still drags to the overall manufacturing outlook. Expected low oil prices at least till the end of 2020, will likely further depress growth in the chemicals and transport engineering clusters.
On the bright side though is that despite the year-on-year dip in electronics production, demand for digital solutions amid the rise of work-from-home working culture remains encouraging. On a month-on-month seasonally adjusted basis, the sector remained strong, especially in semiconductors (+18.1% m/m or the highest in 9 months), computer peripherals & data storage (+19.9% m/m; the highest in 9 months), information communications & consumer electronics (+25.4% m/m; highest since October 2013) which is in line with view of the Economic Development Board (EDB) that rise in demand for cloud services demand and the implementation of the 5G network will benefit the semiconductor sector. Our view is that the fall in biomedical production may be transient due to likely continued demand for the rest of the year though there may be weakness in the next two months due to the high base prints a year ago (Aug 2019 +19.2% y/y; Sept 2019 +27.8% y/y).
This publication shall not be copied or disseminated, or relied upon by any person for whatever purpose. The information herein is given on a general basis without obligation and is strictly for information only. This publication is not an offer, solicitation, recommendation or advice to buy or sell any investment product, including any collective investment schemes or shares of companies mentioned within. Although every reasonable care has been taken to ensure the accuracy and objectivity of the information contained in this publication, UOB Asset Management Ltd (“UOBAM”) and its employees shall not be held liable for any error, inaccuracy and/or omission, howsoever caused, or for any decision or action taken based on views expressed or information in this publication. The information contained in this publication, including any data, projections and underlying assumptions are based upon certain assumptions, management forecasts and analysis of information available and reflects prevailing conditions and our views as of the date of this publication, all of which are subject to change at any time without notice. Please note that the graphs, charts, formulae or other devices set out or referred to in this document cannot, in and of itself, be used to determine and will not assist any person in deciding which investment product to buy or sell, or when to buy or sell an investment product. UOBAM does not warrant the accuracy, adequacy, timeliness or completeness of the information herein for any particular purpose, and expressly disclaims liability for any error, inaccuracy or omission. Any opinion, projection and other forward-looking statement regarding future events or performance of, including but not limited to, countries, markets or companies is not necessarily indicative of, and may differ from actual events or results. Nothing in this publication constitutes accounting, legal, regulatory, tax or other advice. The information herein has no regard to the specific objectives, financial situation and particular needs of any specific person. You may wish to seek advice from a professional or an independent financial adviser about the issues discussed herein or before investing in any investment or insurance product. Should you choose not to seek such advice, you should consider carefully whether the investment or insurance product in question is suitable for you.
Invest in your mind. Receive our curated insights in your inbox.
Subscribe