UOB bank


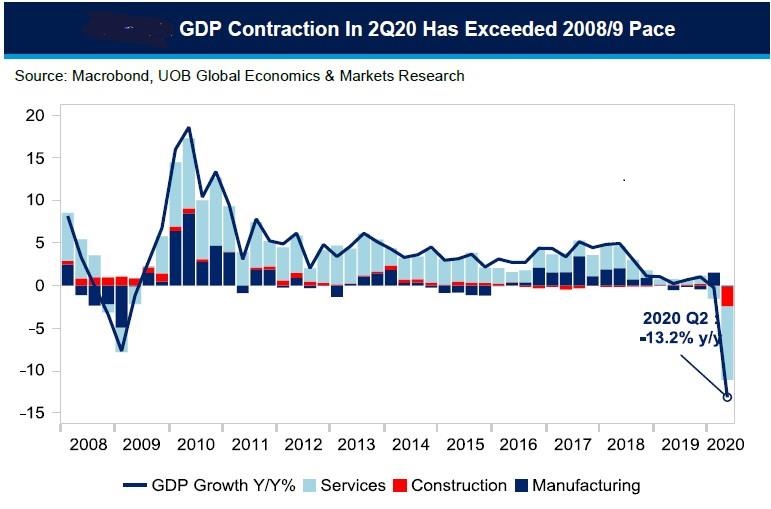
Singapore’s 2Q20 GDP had contracted 13.2% year-on-year (-42.9% quarter-on-year and seasonally adjusted annual rate), down from the previous advanced estimates at -12.6% y/y (-41.2% q/q SAAR) which solidifies the Republic’s first technical recession since 1Q09, and the worst contraction on record.
The downgrade from the advanced estimates was primarily led by a decline in manufacturing activities which fell 0.7% in 2Q20 instead of the advanced estimates of +2.5%. The final GDP for 2Q has prompted the Ministry of Trade and Industry (MTI) to revise the contraction range for 2020 to between -5% and -7% from the prior range of -4% to -7%.
The services sector fell 13.4% y/y (advanced estimates -13.6%) as tourism-related sectors such as retail, accommodation and air travel were severely affected. The construction sector plunged -59.3% y/y over the same period compared to -1.2% in 1Q20. The sharp decline was mainly due to the manpower disruptions arising from movement restrictions at foreign worker dormitories, which led to the stoppage of “almost all construction activities” during the circuit breaker period. With COVID-19 testing of migrant workers completed by 7 August, the majority of workers should be able to resume work by mid-late August.
Outlook
Despite the dismal data, it is our view the dip in GDP has bottomed in 2Q20 as Circuit Breaker restrictions are being eased gradually. While the GDP will remain in contraction, it will be at a more moderate pace in the second half of 2020. The three drivers for gradual recovery will come from (1) improvement in the COVID-19 situation in Singapore, (2) opening up of tourist attractions from 1 July and (3) support from the biomedical industry in the midst of stronger pharmaceutical-related demand.
At this juncture, we also recognise that the likelihood of stronger-than-expected demand for semiconductors and semiconductor equipment in 2H20. In addition, pockets in the services sector including finance & insurance, information & communications may see further expansions in the second half of this year.
In the latest revised figures from Enterprise Singapore (ESG), total trade for Singapore is still forecast to contract by 8% to 10% (up from -9% to -12%), even though non-oil domestic exports (NODX) is now expected to expand by between 3% and 5% (up from -1% to -4%). The upgrade to trade expectations comes on the heels of a 16.5% surge in NODX in June 2020, led by an increase in both electronic exports (+22.2% y/y) and non-electronic exports (+14.5% y/y).
The downside risks at this juncture include those of a COVID-19 resurgence and the heating up of geopolitical and trade tensions especially between the US and China which will hurt already weakened global trade. Given the fluid nature of the pandemic worldwide and the impact of global trade to manufacturing coupled by the downturn in the construction and services sector in Singapore, we have downgraded our full-year GDP outlook to -5.0% in 2020, down from a previous -4.0%.
This publication shall not be copied or disseminated, or relied upon by any person for whatever purpose. The informationherein is given on a general basis without obligation and is strictly for information only. This publication is not an offer,solicitation, recommendation or advice to buy or sell any investment product, including any collective investmentschemes or shares of companies mentioned within. Although every reasonable care has been taken to ensure theaccuracy and objectivity of the information contained in this publication, UOB Asset Management Ltd (“UOBAM”) andits employees shall not be held liable for any error, inaccuracy and/or omission, howsoever caused, or for any decisionor action taken based on views expressed or information in this publication. The information contained in this publication,including any data, projections and underlying assumptions are based upon certain assumptions, managementforecasts and analysis of information available and reflects prevailing conditions and our views as of the date of thispublication, all of which are subject to change at any time without notice. Please note that the graphs, charts, formulaeor other devices set out or referred to in this document cannot, in and of itself, be used to determine and will not assistany person in deciding which investment product to buy or sell, or when to buy or sell an investment product. UOBAMdoes not warrant the accuracy, adequacy, timeliness or completeness of the information herein for any particularpurpose, and expressly disclaims liability for any error, inaccuracy or omission. Any opinion, projection and otherforward-looking statement regarding future events or performance of, including but not limited to, countries, markets orcompanies is not necessarily indicative of, and may differ from actual events or results. Nothing in this publicationconstitutes accounting, legal, regulatory, tax or other advice. The information herein has no regard to the specificobjectives, financial situation and particular needs of any specific person. You may wish to seek advice from aprofessional or an independent financial adviser about the issues discussed herein or before investing in any investmentor insurance product. Should you choose not to seek such advice, you should consider carefully whether the investmentor insurance product in question is suitable for you.
Invest in your mind. Receive our curated insights in your inbox.
Subscribe