UOB bank


The US has reported its best-ever quarterly economic figures with the advance estimates of its 3Q 2020 GDP rising by 33.1% quarter-on-quarter (Bloomberg Est 32%, UOB Est 21.6%) from -31.4% in 2Q and -5.0% in 1Q 2020, about double the previous record of 16.7% jump in 1Q 1950 since data collection started in 1947.
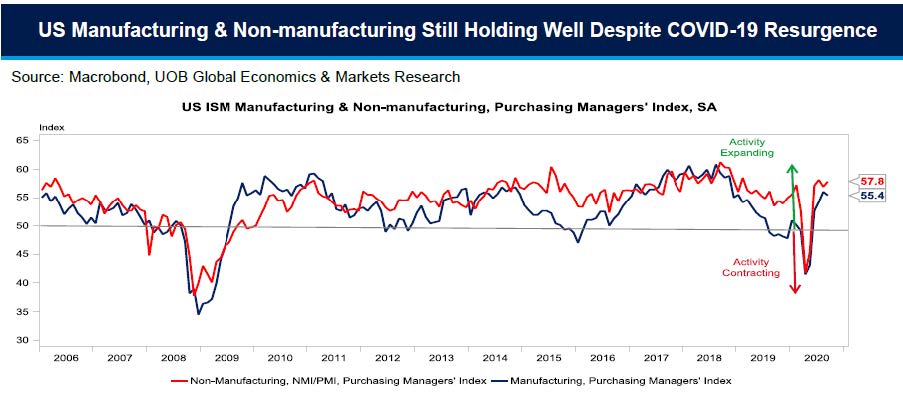
Both US manufacturing and non-manufacturing sectors saw strong rebounds in 3Q with the Institute for Supply Management’s (ISM) manufacturing PMI surveys averaging above 55 for July to September, up from the pandemic low of 41.5 in April. As for services, the ISM survey averaged even higher at 57.6 in 3Q compared to the pandemic low of 41.8 in April.
Business spending staged a strong rebound of 20.3% after plummeting -27.2% in 2Q. Residential investments also performed strongly on the back of low interest rates, rising by 59.3% in 3Q from -35.6% in 2Q. Inventories added 6.6 percentage points to headline growth in 3Q (from -3.5 ppts in 2Q) as the resumption of economic activity after the COVID-19 shutdown of factories replenished the earlier inventory drawdown.
Two components that were previously positive contributors to US headline GDP in 2Q, turned negative in the third quarter. Government’s consumption expenditure & investment (which was previously the biggest positive factor in 2Q thanks to the various fiscal stimulus packages) fell 4.5% (subtracting - 0.68 ppt from headline GDP) due to declines in both federal spending (excluding defence) which fell 18.1% (- 0.55 ppt) while state & local spending fell by 3.3% (-0.3 ppt) as government pandemic funding dried up in 3Q. The other negative component was net exports of goods and services which subtracted nearly 3.1 ppts from headline GDP growth as exports’ 59.7% jump (from -64.4% in 2Q) was more than offset by the 91.1% spike in imports in 3Q (from 54.1% in 2Q).
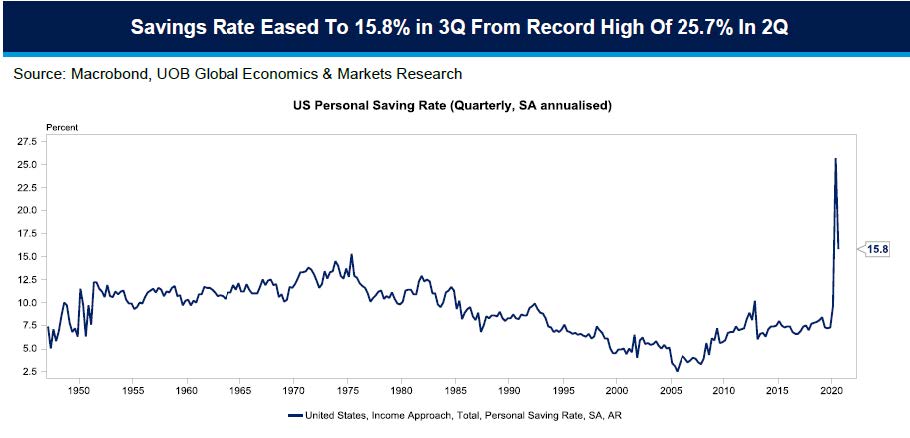
US Savings Rate Off Record Highs
In 3Q, personal savings as a percent of disposable personal income eased markedly to 15.8% from the record 25.7% in 2Q as government social benefit payments slowed. That said, US savings at 3Q is still at higher rate compared to previous decades.
Going forward, the income part of the savings equation will likely decline further in 4Q as the lack of agreement on a fiscal stimulus before the US elections means that personal income has declined for millions of Americans. While we still expect a stimulus package to be announced down the road, the size of the deal including additional payouts for the affected Americans will likely be dependent on the outcome of the US elections – more economic relief under a Democrat clean sweep and less under a divided US Congress.
GDP Outlook – Smaller Contraction, But Economy Not Out Of The Woods Yet
The US may have emerged from most severe technical recession – i.e. two consecutive quarters of sequential declines – since the Great Depression. Further progress on the recovery path, especially for services despite the unprecedented 3Q GDP expansion, however looks shaky and remains "extraordinarily uncertain" due to the failure of the Trump administration and US lawmakers to agree on a new round of fiscal stimulus and rising COVID-19 case counts to unprecedented levels. Much will also hinge on a viable vaccine which we project will likely emerge in early 2021 and available for widespread and effective distribution in mid-2021.
We now project flat 4Q 2020 growth (0% q/q) as the rebound in the second half will still not offset the 1H contraction even though it is less severe than previously projected. Full-year 2020 GDP is now expected to contract by 3.8% (from the previous projection of - 4.5% made in September). This is slightly less optimistic compared to the Fed’s forecast of 3.7% contraction for 2020, but better than the 4.3% contraction estimated by the International Monetary Fud (IMF) in its October 2020 update. As for 2021, our projection is for a US GDP rebound at 2.8%.
Much however ride on the trajectory of the virus and degree of success in its containment. If the infection rates continue at its current pace or worsen, it may necessitate some of the previous restrictive measures to curb the spread which will re-inflict damage to the labor market.
The US economy had lost a staggering 22 million jobs in March and April. Even with the sterling gains between May and September, total non-farm employment is still 10.7 million or 7% lower than in February. The virus resurgence could derail the jobs recovery.
The 2nd estimate of the 3Q 2020 GDP will be on 25 November which will also include 3Q corporate profits data while the next US Federal Reserve's FOMC has been scheduled for 4-5 Nov 2020 – after the US elections on 3 Nov – with decision on 6 Nov followed by a press conference helmed by Fed chair Jerome Powell. In the event of a contested US election result leading to uncertainty, we are likely to see the Fed stepping up to smoothen market volatility.
Click here for more details from the US 3Q 2020 GDP advance estimate by BEA.
This publication shall not be copied or disseminated, or relied upon by any person for whatever purpose. The information herein is given on a general basis without obligation and is strictly for information only. This publication is not an offer, solicitation, recommendation or advice to buy or sell any investment product, including any collective investment schemes or shares of companies mentioned within. Although every reasonable care has been taken to ensure the accuracy and objectivity of the information contained in this publication, UOB Asset Management Ltd (“UOBAM”) and its employees shall not be held liable for any error, inaccuracy and/or omission, howsoever caused, or for any decision or action taken based on views expressed or information in this publication. The information contained in this publication, including any data, projections and underlying assumptions are based upon certain assumptions, management forecasts and analysis of information available and reflects prevailing conditions and our views as of the date of this publication, all of which are subject to change at any time without notice. Please note that the graphs, charts, formulae or other devices set out or referred to in this document cannot, in and of itself, be used to determine and will not assist any person in deciding which investment product to buy or sell, or when to buy or sell an investment product. UOBAM does not warrant the accuracy, adequacy, timeliness or completeness of the information herein for any particular purpose, and expressly disclaims liability for any error, inaccuracy or omission. Any opinion, projection and other forward-looking statement regarding future events or performance of, including but not limited to, countries, markets or companies is not necessarily indicative of, and may differ from actual events or results. Nothing in this publication constitutes accounting, legal, regulatory, tax or other advice. The information herein has no regard to the specific objectives, financial situation and particular needs of any specific person. You may wish to seek advice from a professional or an independent financial adviser about the issues discussed herein or before investing in any investment or insurance product. Should you choose not to seek such advice, you should consider carefully whether the investment or insurance product in question is suitable for you.
Invest in your mind. Receive our curated insights in your inbox.
Subscribe