China: Robust August data points to stronger 3Q growth

  • Singapore: A Brighter 2021 after GDP contraction in 2020Singapore: A Brighter 2021 after GDP contraction in 2020
Share: Share to Facebook Share to Twitter Share to LinkedIn


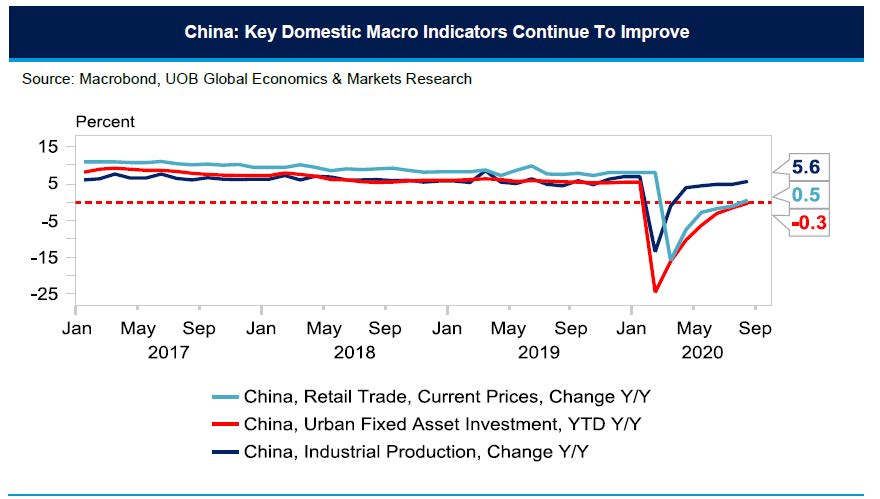
China’s post-pandemic recovery has continued to gain momentum with economic data improving across all indicators in August. The industrial production has turned positive year-to-date with recent gains offsetting the steep declines at the start of the year while retail sales finally saw its first year-on-year growth this year.

Industrial production growth had accelerated to 5.6% year-on-year (y/y) in August (Bloomberg estimates +5.1%, Jul +4.8%) or the fifth straight month of gains led by machineries (+15.1% vs. 15.6% in Jul), automobiles (+14.8% vs. 21.6% in Jul), general equipment (+10.9% vs. 9.6% in Jul) and telecom/computers (+8.7% vs. 11.8% in Jul). With the sustained gains, industrial production has finally turned the corner with a +0.4% y/y increase compared to -0.4% in July.

Retail sales also came in above expectation at +0.5% y/y (Jul -1.1%) registering its first positive growth since the start of the year. The rebound was led by sales of telecom appliances (+25.1%), cosmetics (+19.0%), jewellery (+15.3%) and automobiles (+11.8%). Sales at restaurants however remain in the red at -7.0% y/y in August (-26.6% YTD) as tourism will take much longer to recover. Overall, the rebound in August has narrowed the year-to-date (YTD) decline in retail sales to -8.6% y/y from -9.9% y/y in the preceding month. In contrast, the e-commerce sales have risen 9.5% y/y YTD.


Fixed asset investment (FAI) was slightly better than market forecast at -0.3% y/y YTD (Bloomberg est -0.4%, Jul -1.6%). Within the secondary industries, investment in energy and water infrastructure was up 18.4%; while mining and manufacturing investments were down at -9.5% and -8.1% respectively. Infrastructure investment excluding utilities fell 0.3% y/y YTD compared with real estate investment of 4.6%.

The urban jobless rate also edged lower to 5.6% (Jul 5.7%) coming off from a high of 6.2% in February as the economy continues to be back on track. The stronger than expected rebound in economic activities is likely to bring the unemployment rate lower to around 5.4% by end-2020, just a touch higher than 5.2% at the end of 2019.

The economic data in August, including the stronger-than-expected trade and credit growth, all point towards an acceleration in 3Q GDP growth. The rebound in retail sales to positive growth territory suggests that demand is finally catching up to supply side recovery though state measures to prevent a resurgence in COVID-19 infections as well as support SMEs hard-hit by the pandemic will need to stay in place.

We now see some upside risk to our GDP forecast at 4.9% for 3Q and 5.7% for 4Q (2Q: 3.2%) for full-year 1.8% growth. The strong credit growth numbers for August have effectively reduced the need for the People’s Bank of China (PBoC) to cut its benchmark interest rates next week (21 Sep). The prospect for rate cuts in the coming months has also fallen significantly as the economy continues to rebound though the central bank will likely maintain targeted support to SMEs to facilitate a sustained recovery.

This publication shall not be copied or disseminated, or relied upon by any person for whatever purpose. The information herein is given on a general basis without obligation and is strictly for information only. This publication is not an offer, solicitation, recommendation or advice to buy or sell any investment product, including any collective investment schemes or shares of companies mentioned within. Although every reasonable care has been taken to ensure the accuracy and objectivity of the information contained in this publication, UOB Asset Management Ltd (“UOBAM”) and its employees shall not be held liable for any error, inaccuracy and/or omission, howsoever caused, or for any decision or action taken based on views expressed or information in this publication. The information contained in this publication, including any data, projections and underlying assumptions are based upon certain assumptions, management forecasts and analysis of information available and reflects prevailing conditions and our views as of the date of this publication, all of which are subject to change at any time without notice. Please note that the graphs, charts, formulae or other devices set out or referred to in this document cannot, in and of itself, be used to determine and will not assist any person in deciding which investment product to buy or sell, or when to buy or sell an investment product. UOBAM does not warrant the accuracy, adequacy, timeliness or completeness of the information herein for any particular purpose, and expressly disclaims liability for any error, inaccuracy or omission. Any opinion, projection and other forward-looking statement regarding future events or performance of, including but not limited to, countries, markets or companies is not necessarily indicative of, and may differ from actual events or results. Nothing in this publication constitutes accounting, legal, regulatory, tax or other advice. The information herein has no regard to the specific objectives, financial situation and particular needs of any specific person. You may wish to seek advice from a professional or an independent financial adviser about the issues discussed herein or before investing in any investment or insurance product. Should you choose not to seek such advice, you should consider carefully whether the investment or insurance product in question is suitable for you.

Invest in your mind. Receive our curated insights in your inbox.

Subscribe