3Q 2025 MARKET DEVELOPMENTS
- Global equities extended their rally in Q3, driven by strong earnings, resilient consumer spending, and AI optimism.
- Asian markets surged on tech and AI momentum, with China and Japan outperforming, while India lagged due to tariff headwinds and visa fee hikes.
- Bond markets saw modest gains as dovish Fed signals and soft labour data supported rate cut expectations, but caution remains amid inflation concerns.
Asset class performance (% in SGD terms)
Source: FactSet/Bloomberg. Performance as at 30 September 2025.
Indices used as follows: Global Equities: MSCI All Country World Index (ACWI);
Global Bonds: Bloomberg Global Aggregate Index;
Asian Equities: MSCI AC Asia ex Japan Index; and
Asian Bonds: J.P.Morgan Asia Credit (JACI) Investment Grade Index on a Net Asset Value basis;
SGD Cash: 3M Singapore Overnight Rate Average (SORA)
Please note that there are limitations to the use of such indices as proxies for the past performance in the respective asset classes. The historical performance presented should not be used as a proxy for the future or likely performance.
PORTFOLIO PERFORMANCE
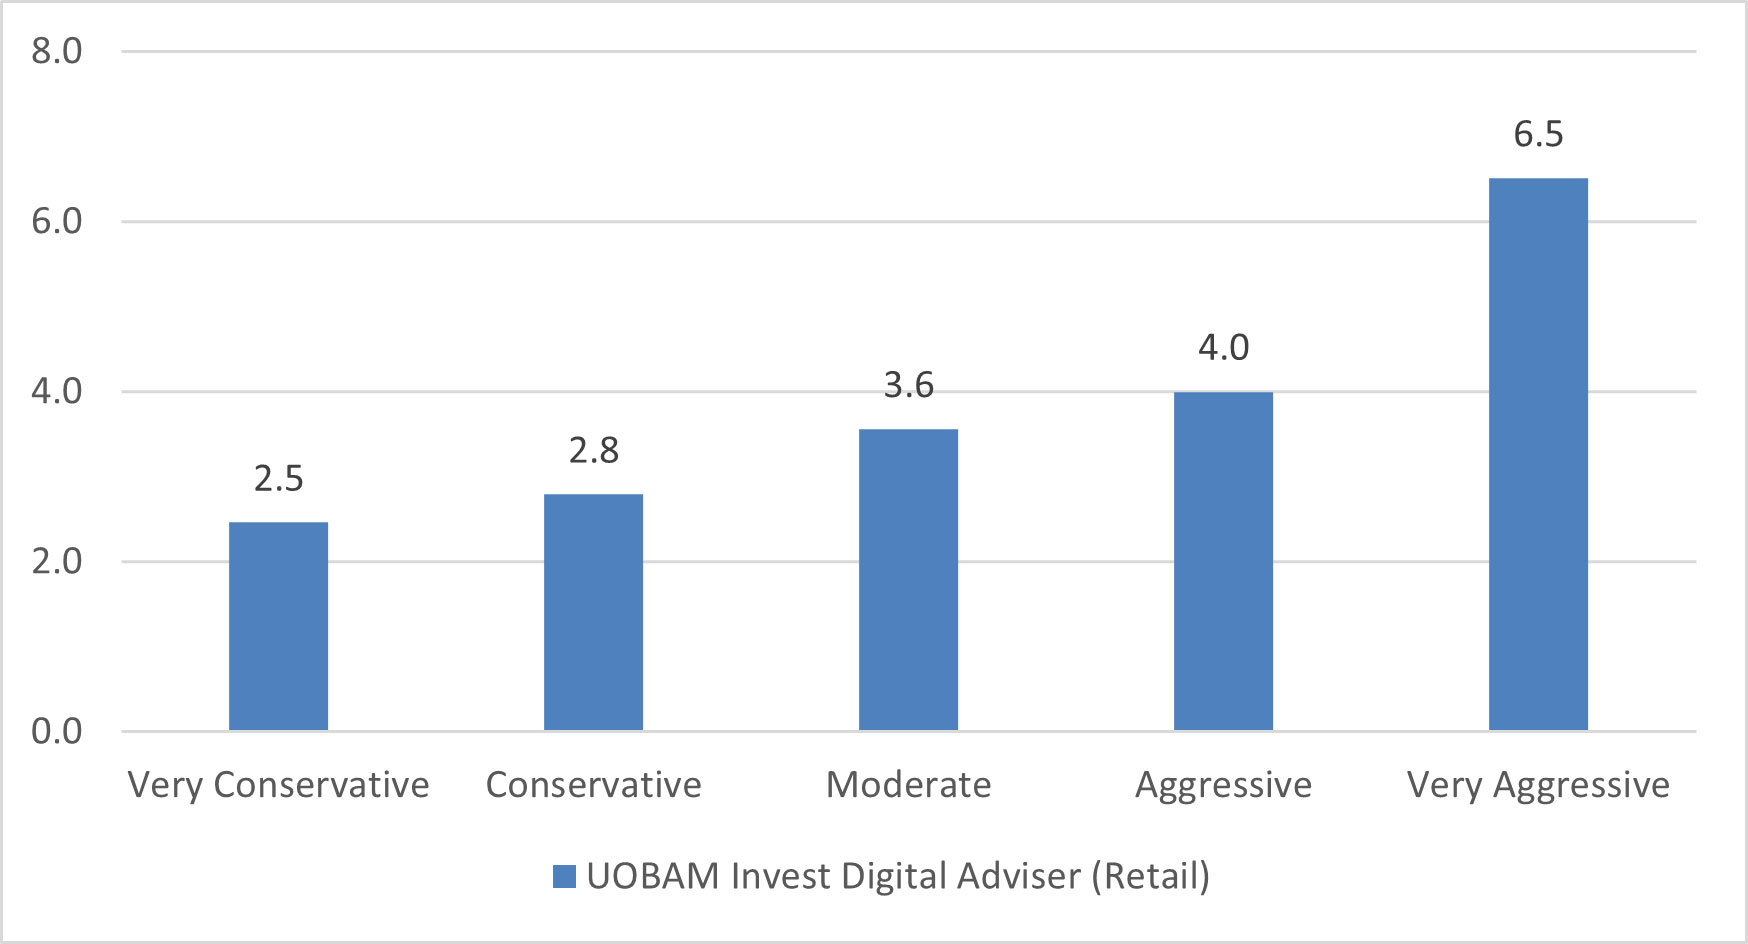
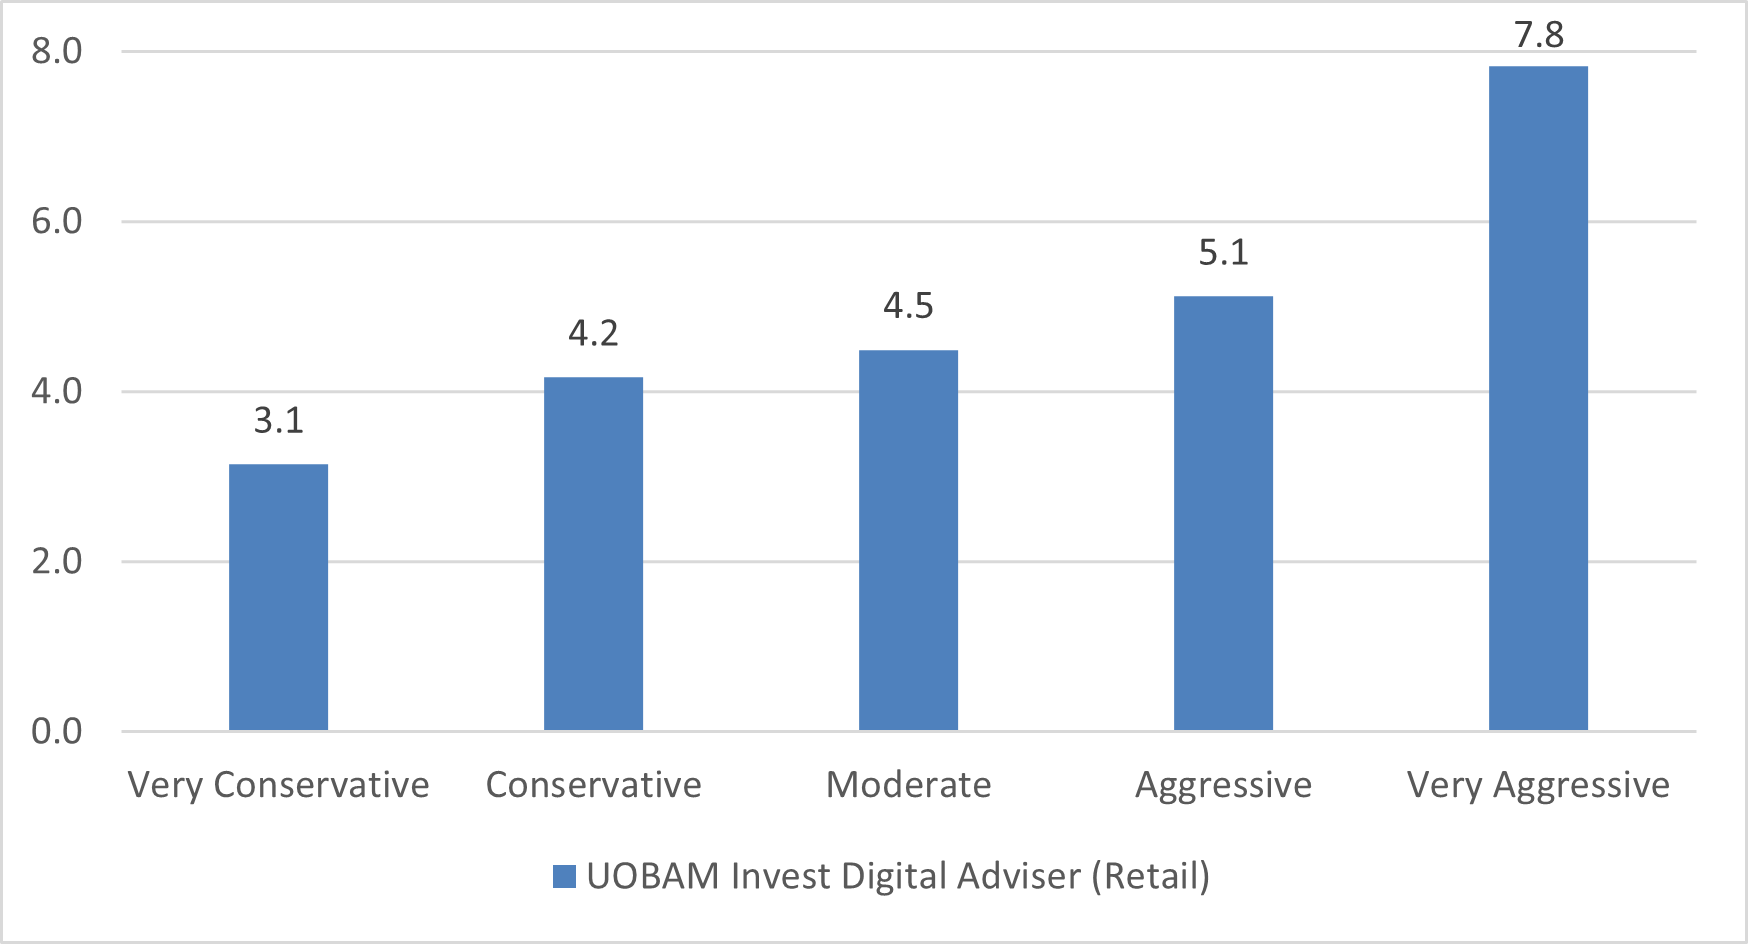
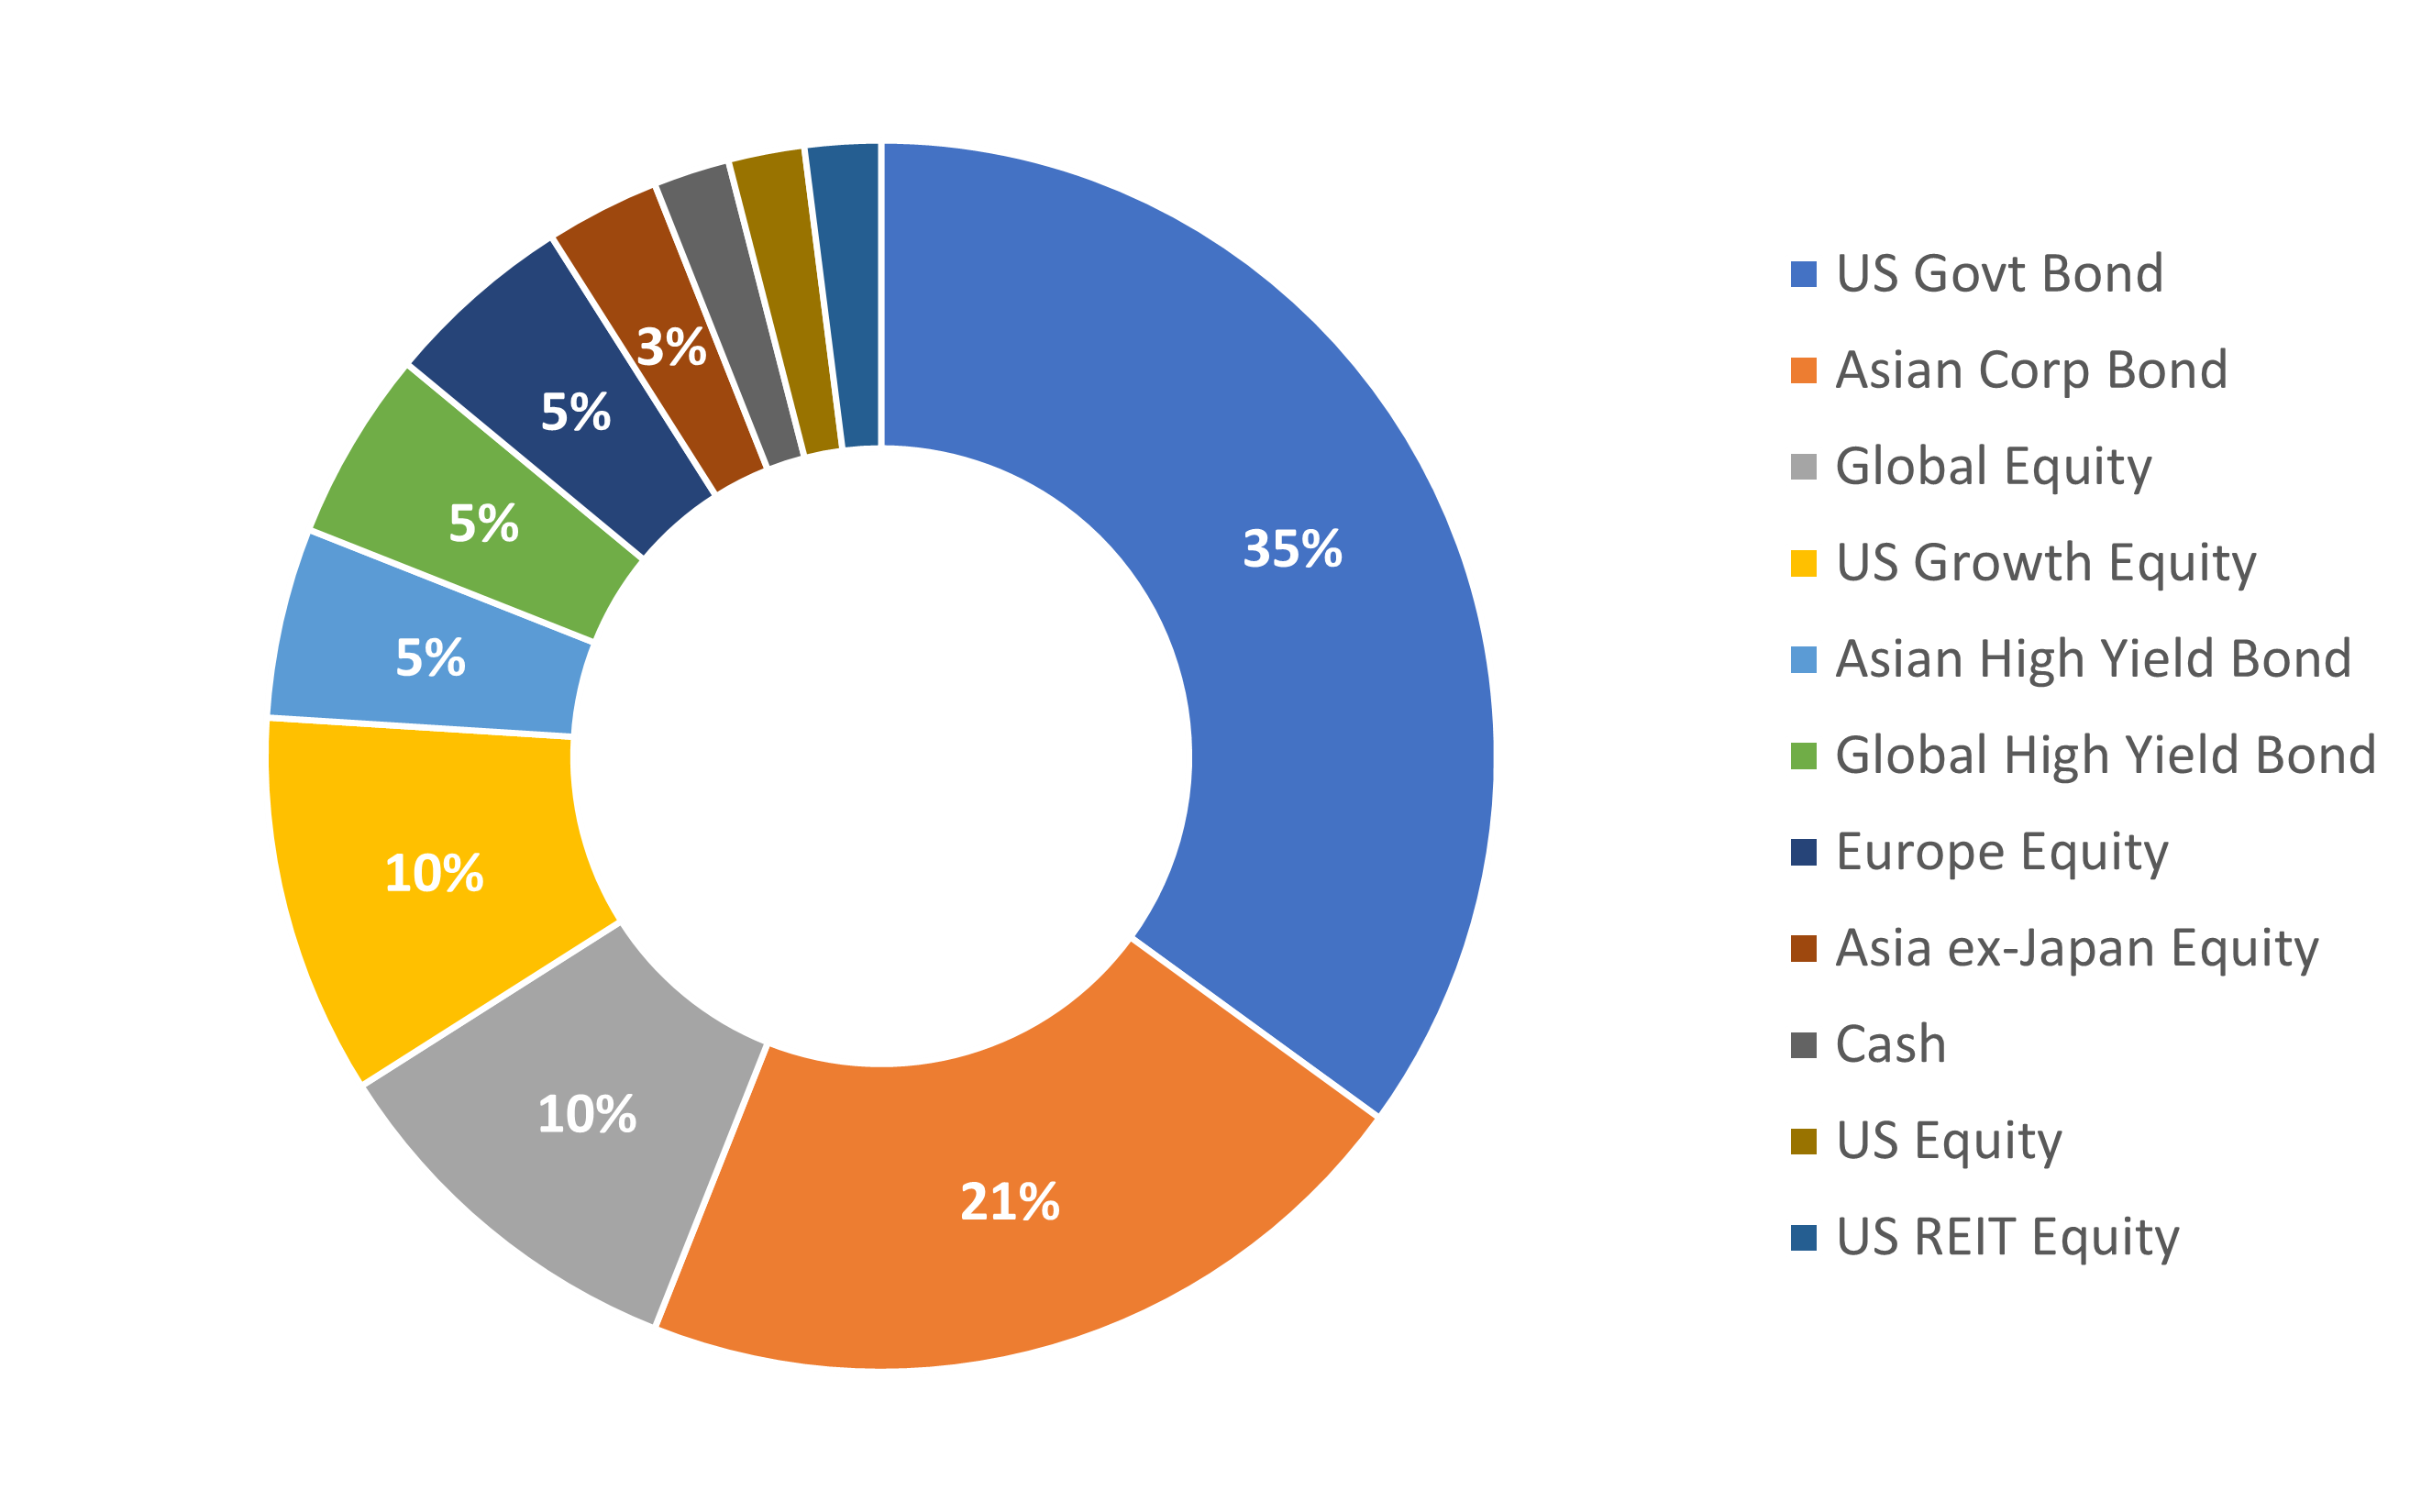
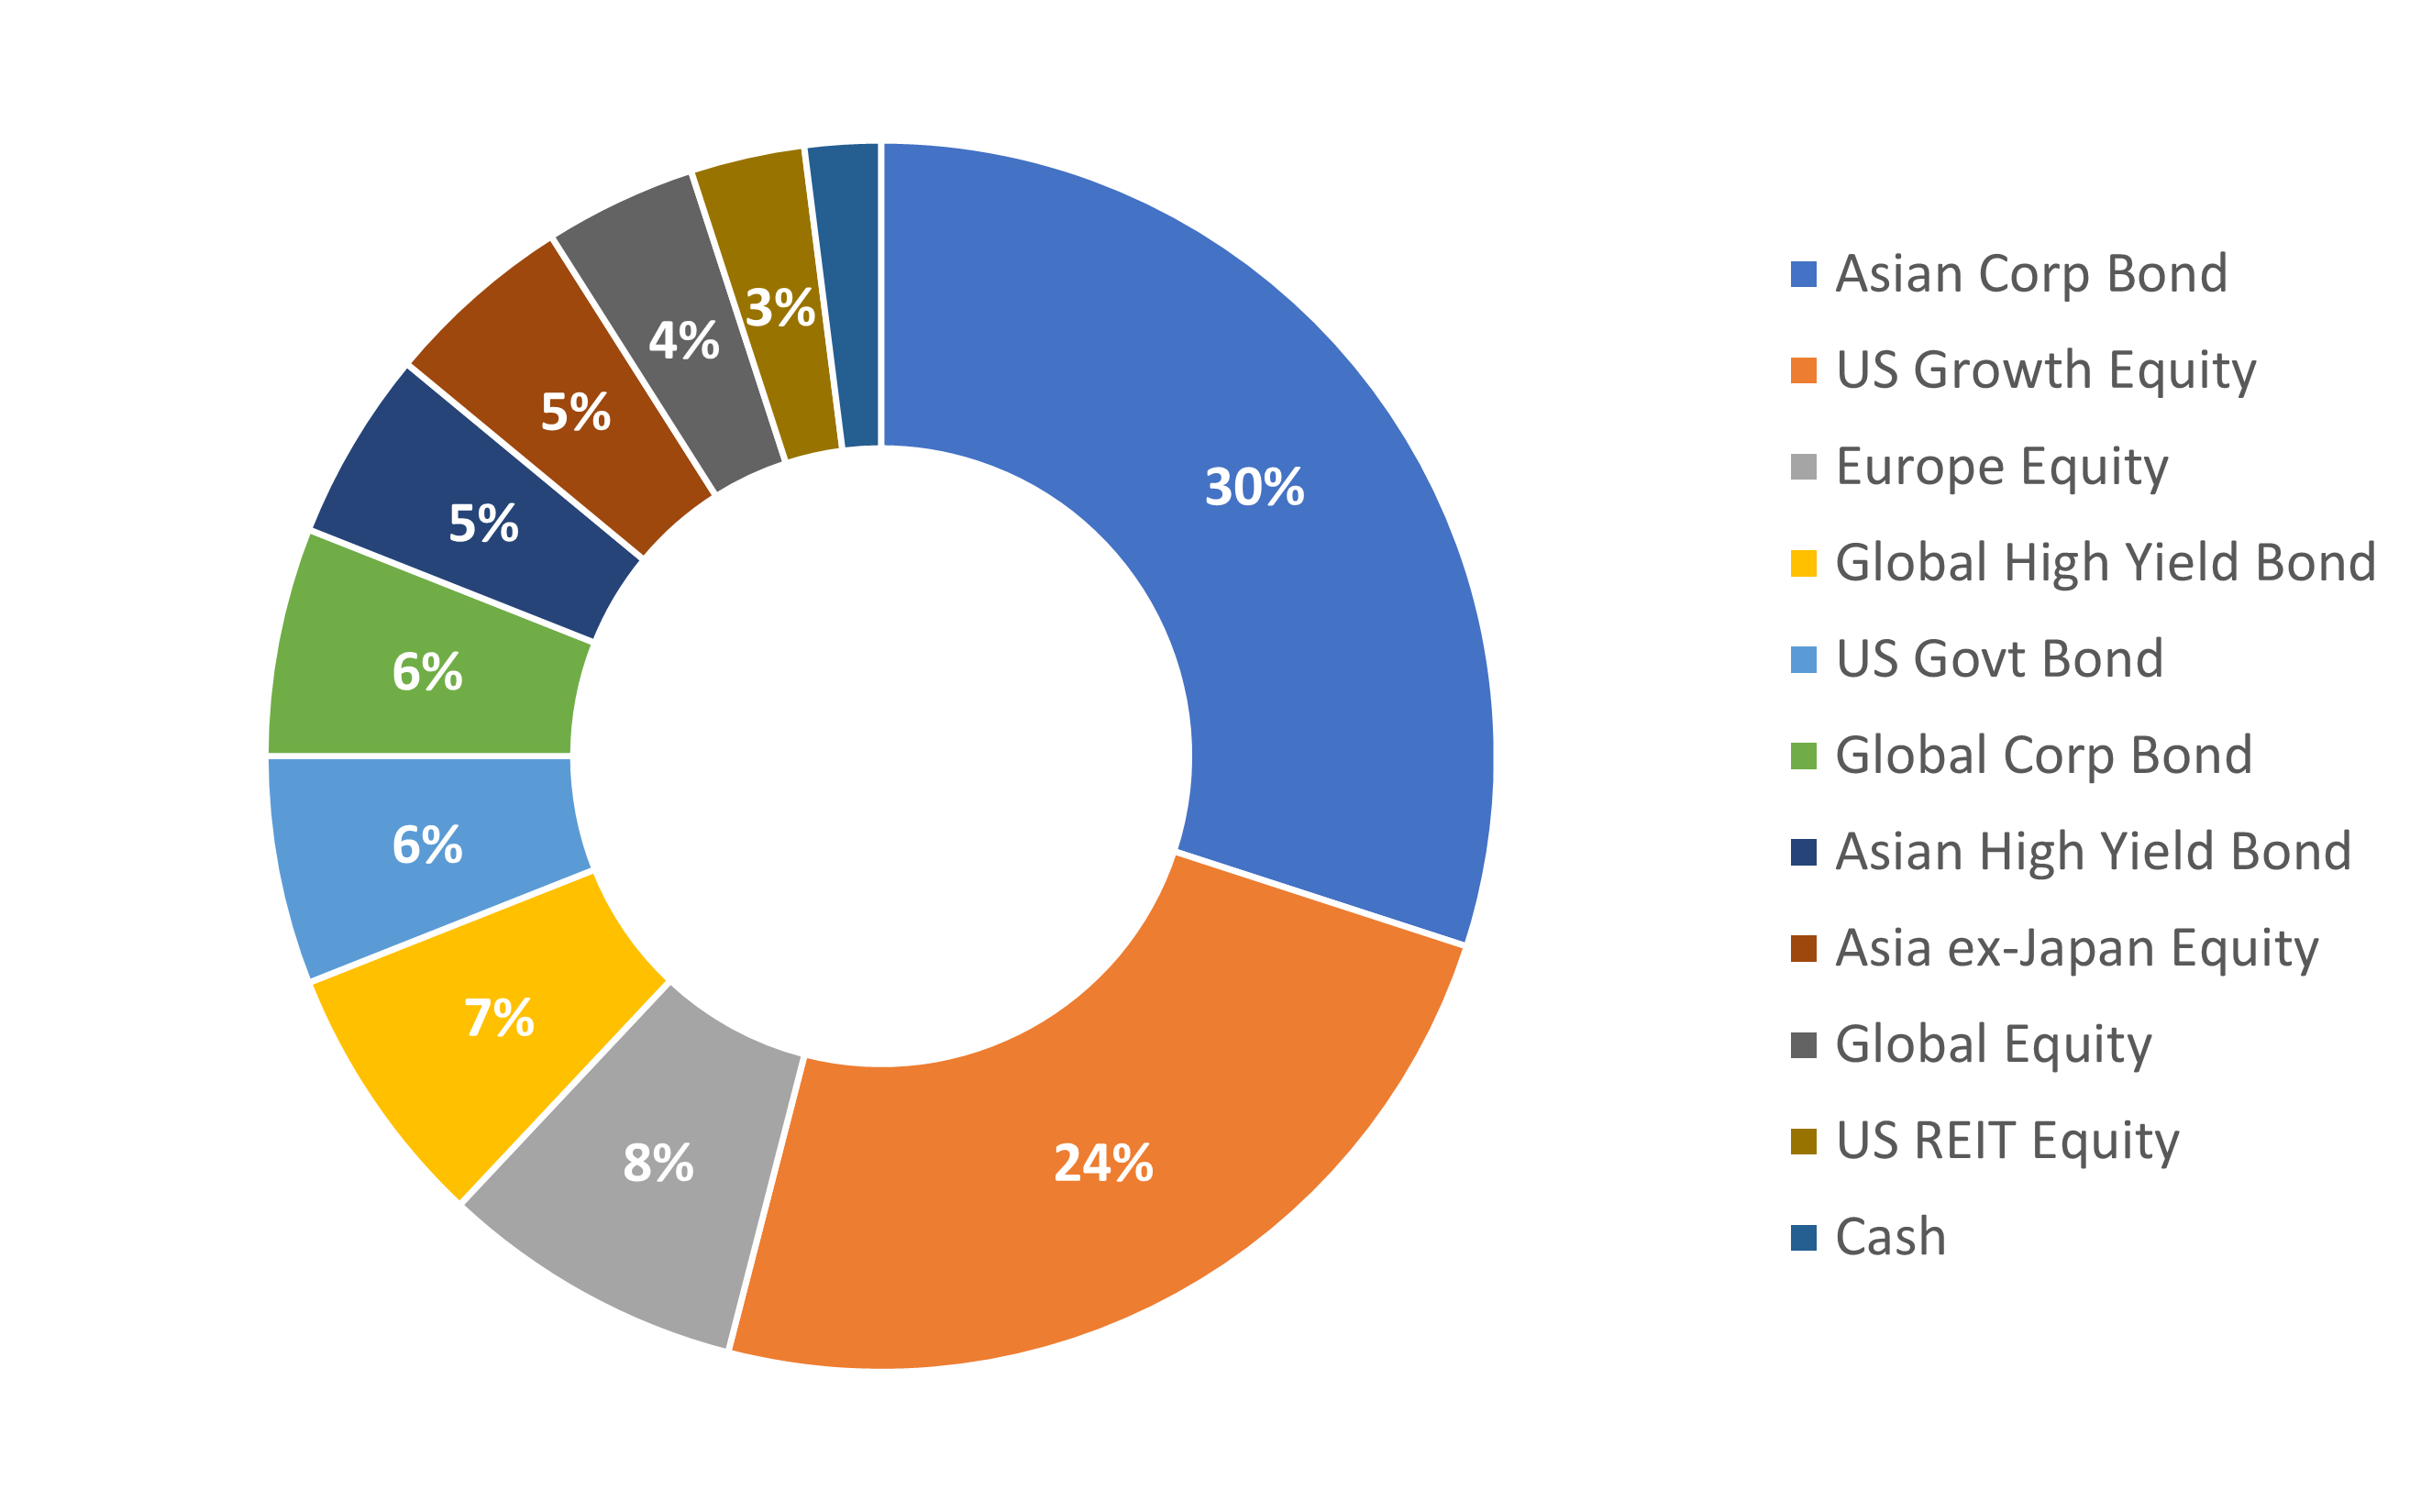
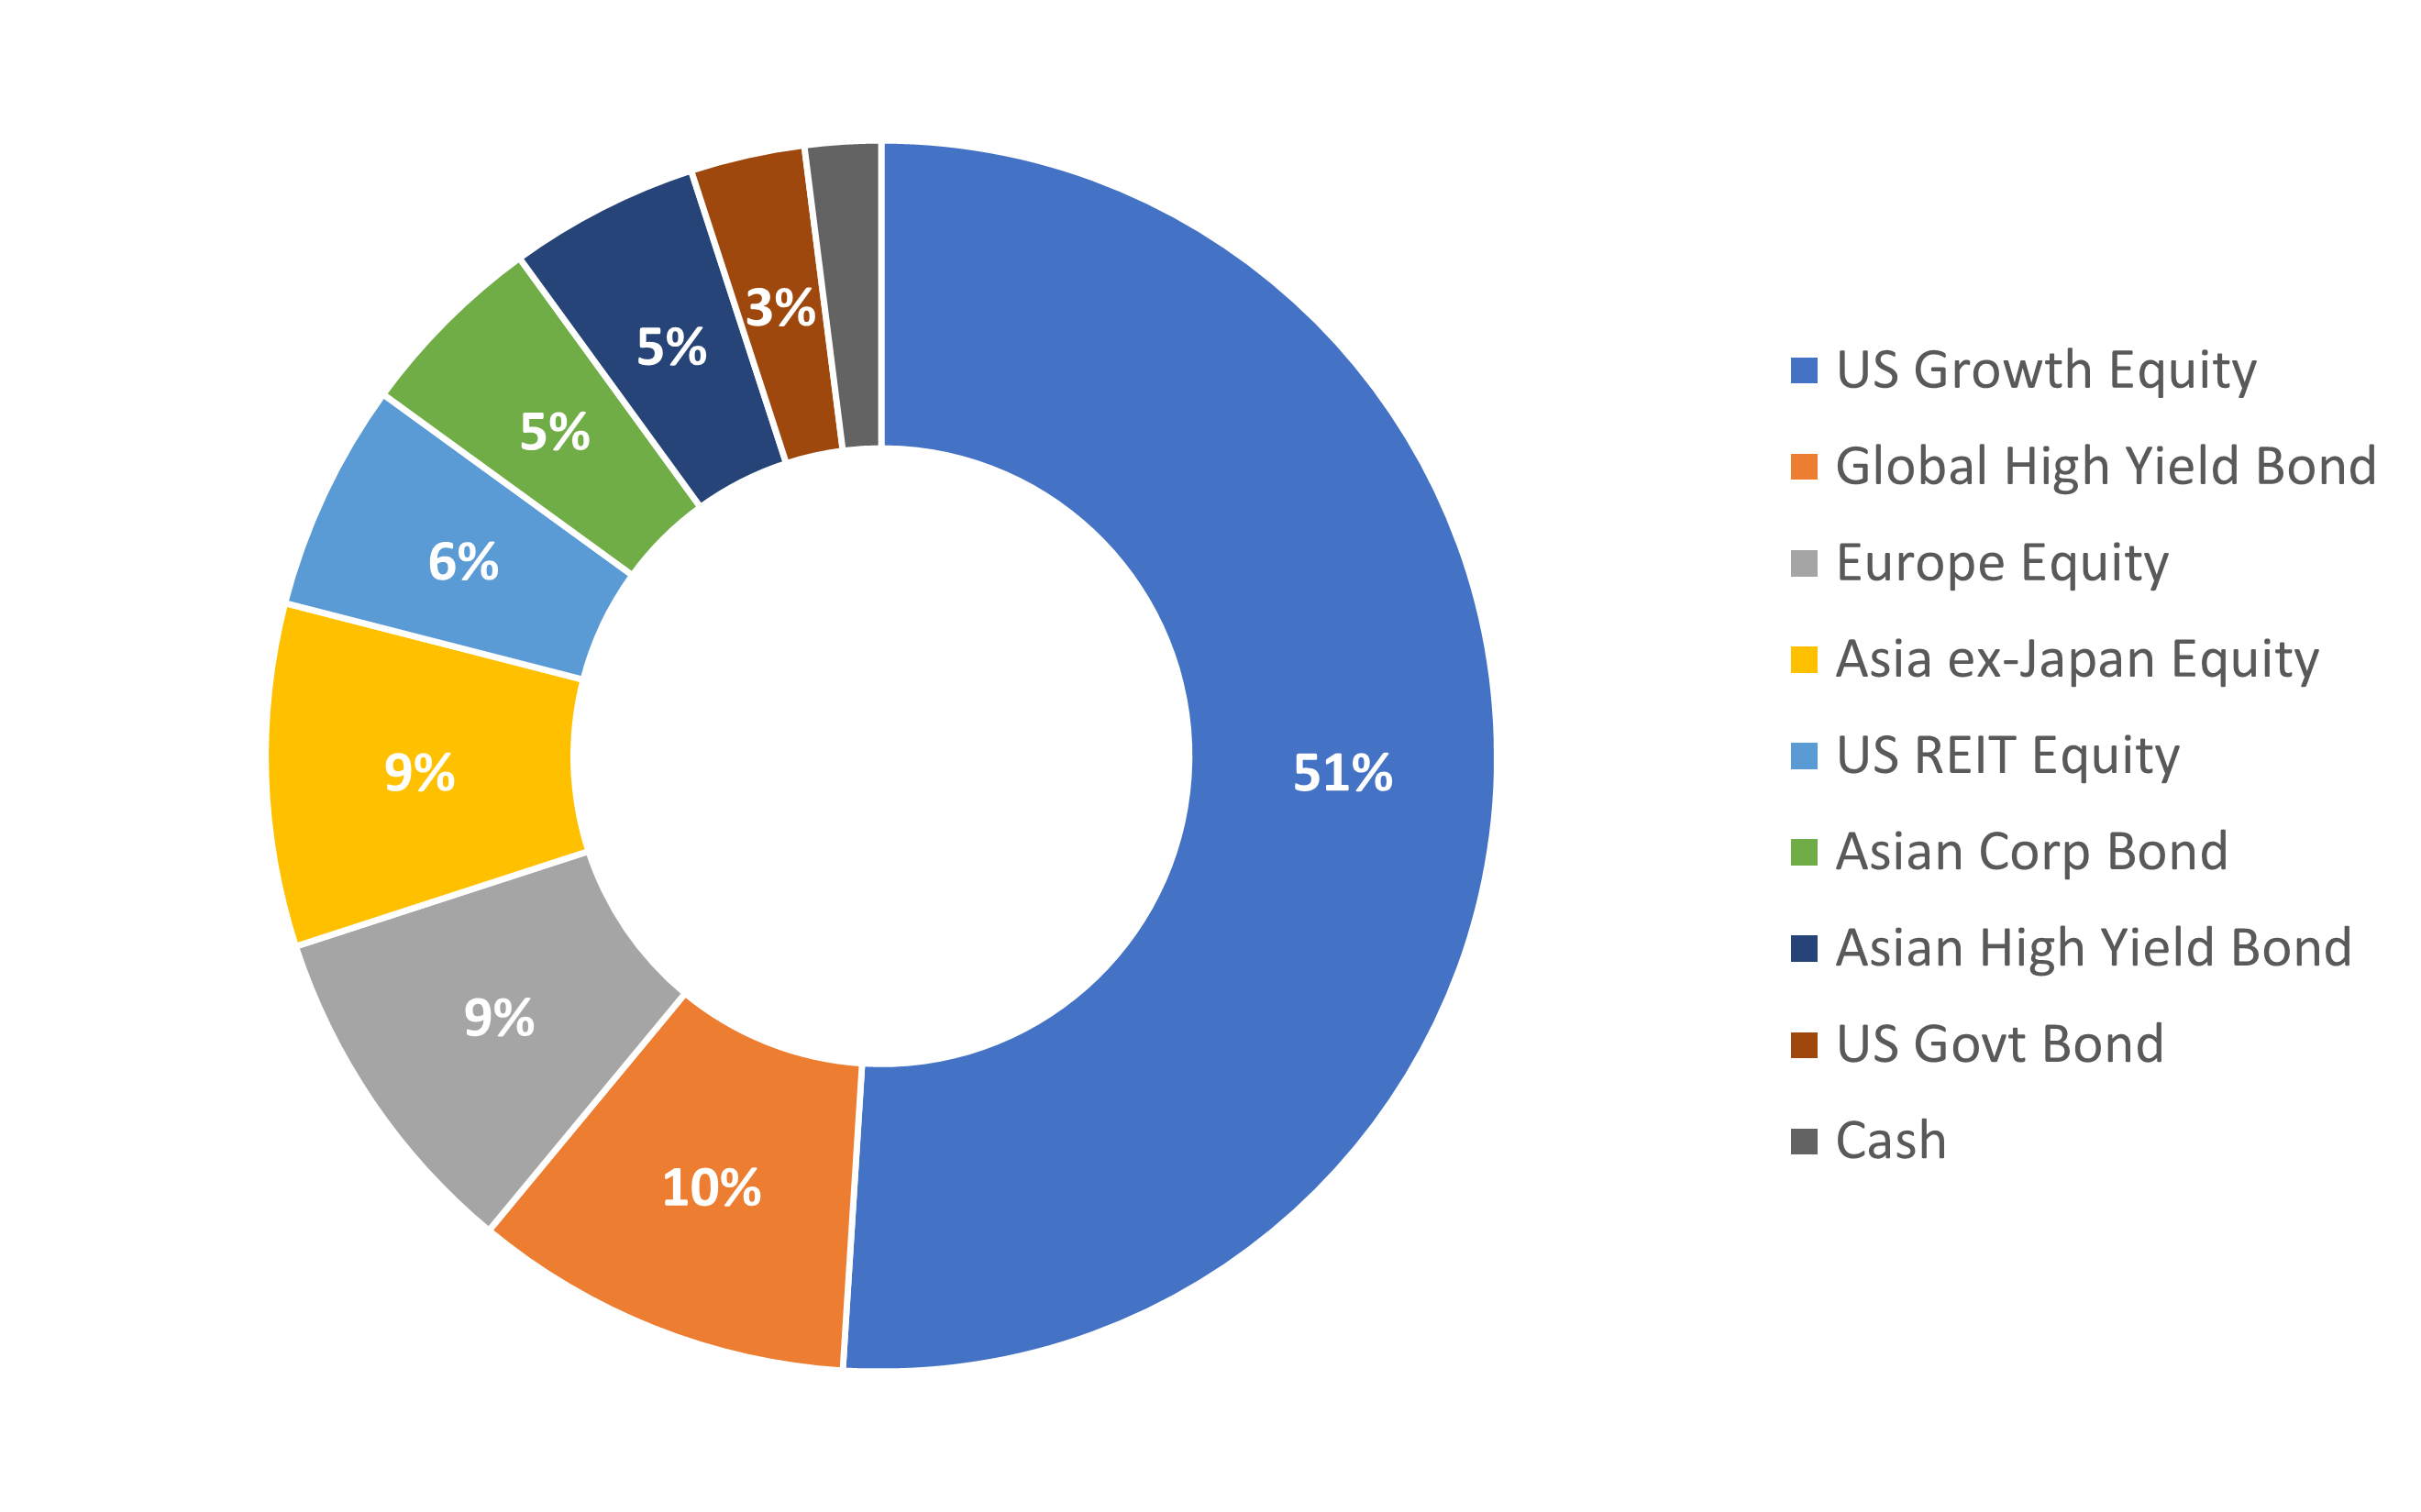
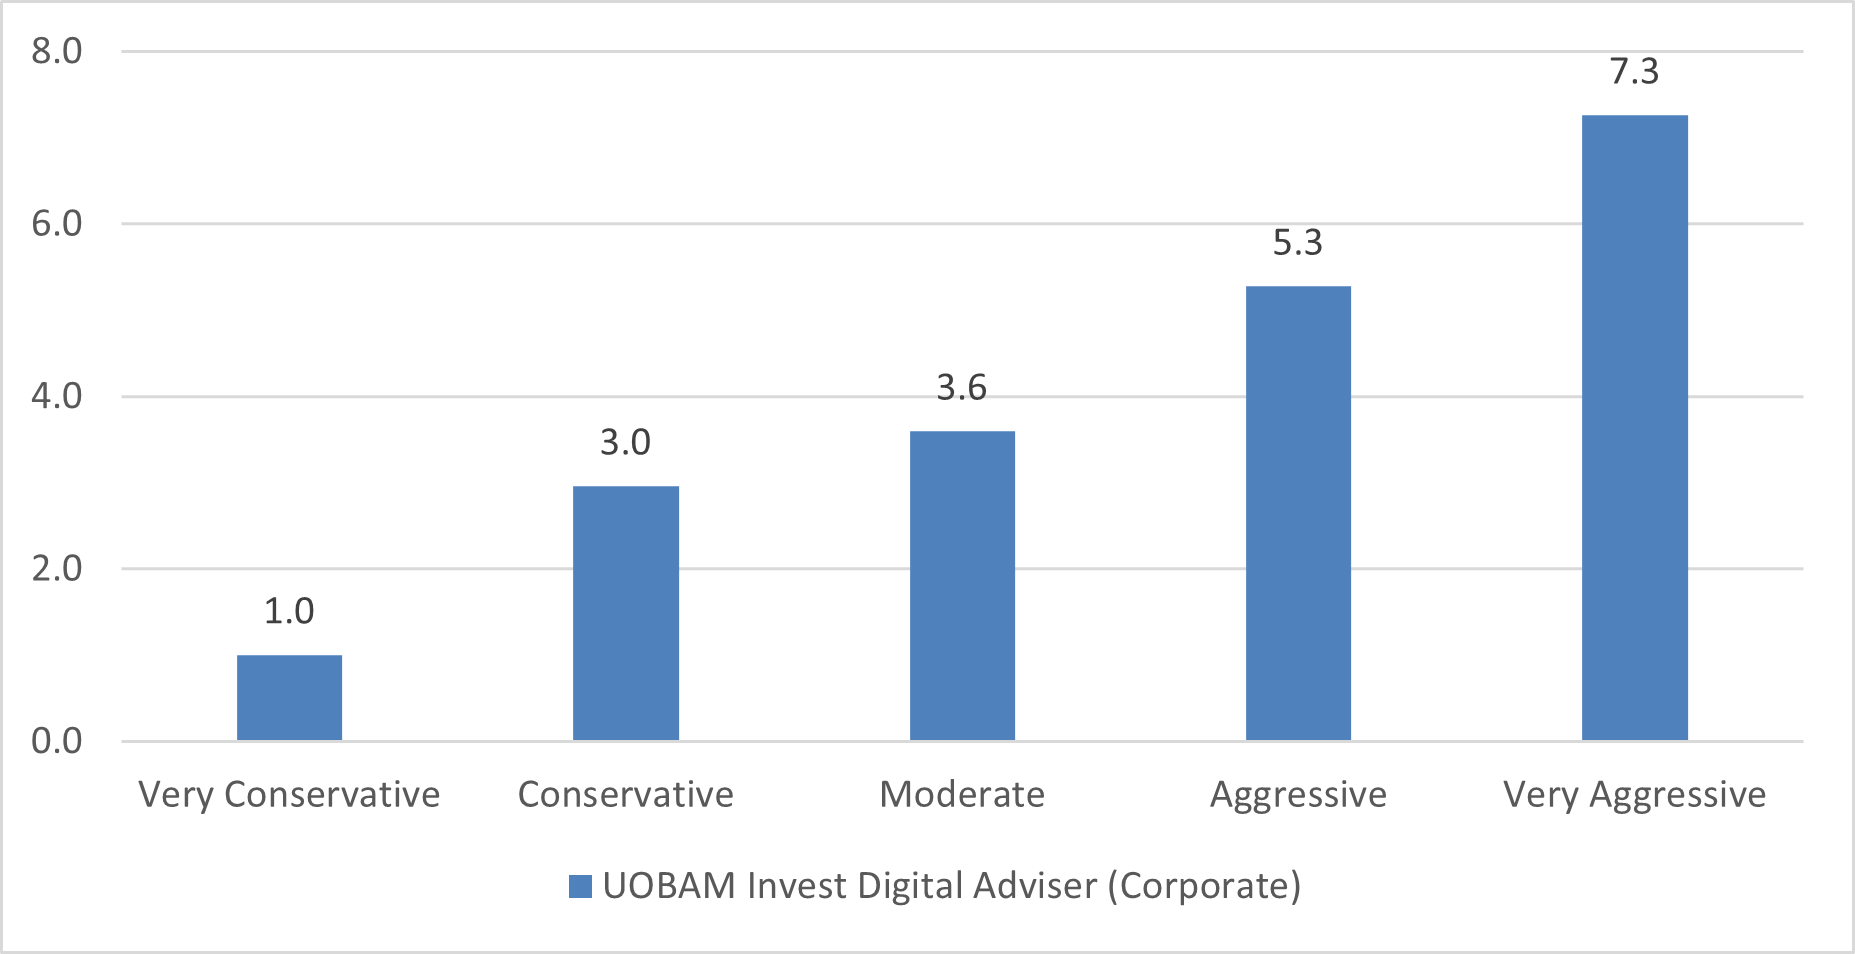
- As of 30 September 2025, UOBAM Invest portfolio returns for the third quarter ranged between 3.1 percent to 7.8 percent.
Portfolio returns (% in SGD terms) 30 June 2025 – 30 September 2025
Source: Factset / UOBAM. Portfolio returns are for the period from 30 June 2025 to 30 September 2025.
Past performance of the portfolio or UOBAM and any past performance, prediction, projection or forecast on the economy or markets are not necessarily indicative of the future or likely performance of the portfolio or UOBAM. Portfolio returns on the scheme is calculated on a single pricing basis.
1. Very Conservative portfolio
| Period (as at 30 September 2025) |
Portfolio Return (%) |
| 3 months |
3.1 |
| 6 months |
2.6 |
| 1 year |
5.4 |
Since Inception
(26 July 2020), per annum |
0.2 |
Source: UOBAM as of 30 September 2025
The information about asset allocation provided herein are subject to change at the discretion of UOBAM without prior notice. Past performance of the portfolio or UOBAM and any past performance, prediction, projection or forecast on the economy or markets are not necessarily indicative of the future or likely performance of the portfolio or UOBAM. Returns are calculated on a single pricing basis.
For the three-month period ending 30 September 2025, this portfolio was up 3.1%. The largest contributor was US government bonds while Europe equities contributed the least.
Over the one-year period, the portfolio gained 5.4%. The largest contributor was US equities while Asia investment grade bonds contributed the least.
2. Conservative portfolio
| Period (as at 30 September 2025) |
Portfolio Return (%) |
| 3 months |
4.2 |
| 6 months |
3.4 |
| 1 year |
6.6 |
Since Inception
(26 July 2020), per annum |
2.5 |
Source: UOBAM as of 30 September 2025
The information about asset allocation provided herein are subject to change at the discretion of UOBAM without prior notice. Past performance of the portfolio or UOBAM and any past performance, prediction, projection or forecast on the economy or markets are not necessarily indicative of the future or likely performance of the portfolio or UOBAM. Returns are calculated on a single pricing basis.
For the three-month period ending 30 September 2025, this portfolio was up 4.2%. The largest contributor was US government bonds while money market fund contributed the least.
Over the one-year period, the portfolio gained 6.6%. The largest contributor was global equities while Asia investment grade bonds contributed the least.
3. Moderate portfolio
| Period (as at 30 September 2025) |
Portfolio Return (%) |
| 3 months |
4.5 |
| 6 months |
5.2 |
| 1 year |
8.9 |
Since Inception
(26 July 2020), per annum |
4.7 |
Source: UOBAM as of 30 September 2025
The information about asset allocation provided herein are subject to change at the discretion of UOBAM without prior notice. Past performance of the portfolio or UOBAM and any past performance, prediction, projection or forecast on the economy or markets are not necessarily indicative of the future or likely performance of the portfolio or UOBAM. Returns are calculated on a single pricing basis.
For the three-month period ending 30 September 2025, this portfolio gained 4.5%. The largest contributor was US growth equities while global investment grade bonds contributed the least.
Over the one-year period, the portfolio gained 8.9%. The largest contributor was US growth equities while US REITs detracted.
4. Aggressive portfolio
| Period (as at 30 September 2025) |
Portfolio Return (%) |
| 3 months |
5.1 |
| 6 months |
8.6 |
| 1 year |
11.7 |
Since Inception
(26 July 2020), per annum |
7.5 |
Source: UOBAM as of 30 September 2025
The information about asset allocation provided herein are subject to change at the discretion of UOBAM without prior notice. Past performance of the portfolio or UOBAM and any past performance, prediction, projection or forecast on the economy or markets are not necessarily indicative of the future or likely performance of the portfolio or UOBAM. Returns are calculated on a single pricing basis.
For the three-month period ending 30 September 2025, this portfolio was up 5.1%. The largest contributor was US growth equities while money market funds contributed the least.
Over the one-year period, the portfolio gained 11.7%. The largest contributor was US growth equities while US REITs detracted.
5. Very Aggressive portfolio
| Period (as at 30 September 2025) |
Portfolio Return (%) |
| 3 months |
7.8 |
| 6 months |
14.1 |
| 1 year |
16.9 |
Since Inception
(26 July 2020), per annum |
10.0 |
Source: UOBAM as of 30 September 2025
The information about asset allocation provided herein are subject to change at the discretion of UOBAM without prior notice. Past performance of the portfolio or UOBAM and any past performance, prediction, projection or forecast on the economy or markets are not necessarily indicative of the future or likely performance of the portfolio or UOBAM. Returns are calculated on a single pricing basis.
For the three-month period ending 30 September 2025, this portfolio was up 7.8%. The largest contributor was US growth equities while Asian investment grade bonds contributed the least.
Over the one-year period, the portfolio gained 16.9%. The largest contributor was US growth equities while US REITs detracted.
LOOKING AHEAD
- Markets remain resilient despite macro headwinds, but Q4 may test this strength as tariff effects and inflation risks emerge
- We maintain a neutral, diversified stance with a tilt toward Asia and Europe, where valuations and growth trends are more favourable
- Bond markets offer attractive carry, but caution is warranted amid rising fiscal concerns, inflation risks, and global growth uncertainty
Despite persistent macroeconomic headwinds, markets remain resilient, supported by corporate earnings strength, investor confidence, and liquidity. While tariff and policy uncertainties remain, asset prices have not meaningfully corrected, reflecting optimism and technical support. This resilience, however, may be tested in Q4 as delayed tariff effects begin to impact consumption and inflation. With US GDP growth slowing and employment trends weakening, the risk of the economy reaching “stall speed” is rising. We continue to advocate a neutral and diversified asset allocation strategy, now with a slightly higher probability assigned to continued growth (50%), and equal lower probabilities (25%) to recession and stagflation. A balanced portfolio remains the most prudent approach across these scenarios.
While global growth remains uneven, signs of improvement are encouraging. Europe and China are showing stronger momentum, supported by fiscal stimulus and easing trade tensions. Asia continues to benefit from China’s rebound, AI-driven investment, and a growing domestic consumer base. However, elevated US equity valuations, fragile labour trends, and the potential for rising inflation due to tariffs suggest caution. We maintain a strategic overweight to Europe and Asia equities, where valuations are more attractive and growth trends more stable.
Meanwhile, global bond markets have traded near the lower end of their yield range, with 10-year yields hovering between 4.0% and 4.5%. The Fed’s dovish pivot and easing fiscal concerns, partly due to rising tariff revenues, have supported a rally in US Treasuries. With three rate cuts now priced in, markets are more focused on growth risks than inflation, though both remain relevant. We maintain a neutral stance on credit and duration, reflecting confidence in developed market resilience despite recession and inflation risks. Outside the US, ultra-long yields have risen due to fiscal deficit concerns, especially in Japan. On the other hand, Singapore’s rates have declined amid strong demand for its currency. Slower global growth and heightened geopolitical tensions are compounding challenges for weaker economies. As such, we maintain a preference for investment-grade over high-yield bonds.
We remain tactically neutral across asset classes, reflecting a balanced approach amid macro uncertainties. Given the equal probabilities of market-positive vs market-negative scenarios, we believe a diversified approach is the most resilient and offers the best chance of achieving positive returns across a range of outcomes. We are closely monitoring inflation risks, labour market data, and tariff developments, and stand ready to adjust our positioning as needed.


