
Key Highlights
- Electric vehicles to account for more than half of new car sales by 2040
- Demand for nickel projected to grow at annual rate of 35% in this decade
- Not all nickel mined suitable for battery use complicating supply-demand conditions
Governments around the globe have upped the ante in setting carbon neutral targets through sustainable incentives programmes in light of growing consumer awareness of the need to protect the environment which extends to their choices they make in their purchases of products and services. That would include the mode of transport which explains why electric vehicles (EVs) is gaining momentum.
Global sales are projected to hit 54 million by 2040 or 58% of new car sales (Figure 1) and is projected to account for 8.3% of Global EV Fleet by 2030 (Figure 2). As EV use becomes more widespread, automakers will be offering more EV models for consumers to select from and more importantly, better price competitiveness versus internal combustible engine (ICE) vehicles (Figure 3).
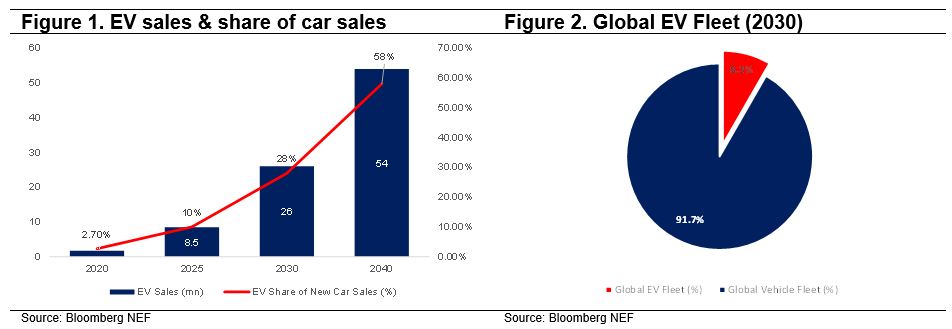
Figure 3. Major global automakers’ EV plans
| No | Automaker | Origin | Global Sales in 2019 (mn) | Target |
| 1 | General Motors | US | 7.7 | Aims for 5mn EV sales by 2030 |
| 2 | Ford | US | 5.4 | Offer 40 electric and electrified vehicles in 2022 model lineup, triple EV offering by 2025 |
| 3 | Honda | Japan | 5.3 | Aims to have EVs and hybrids comprise 2/3 of its vehicles sold worldwide by 2030 |
| 4 | Nissan | Japan | 4.9 | Electrified vehicle will account for 60% of its sales in Japan, 23% in China, and 50% in Europe by 2023 |
| 5 | Toyota | Japan | 10.7 | Expects to sell 5.5 million electric & hybrid cars by 2025 (4.5 million hybrid and plug-in hybrids and 1 million electric and hydrogen fuel cell) |
| 6 | Audi | Europe | 1.2 | Increase its proportion of EV to 33% by 2025 |
| 7 | BMW | Europe | 2.2 | >7 million EVs in 10 years |
| 8 | Mercedes Benz | Europe | 2.3 | EV to account for 50% of its sales in 2030 |
| 9 | Volkswagen | Europe | 4.1 | Battery-electric vehicles to make up 40% of its global fleet by 2030 |
| 10 | Volvo | Europe | 0.7 | Generate 50% of its global sales from EVs by 2025, with the rest hybrids |
| 11 | SAIC Motor | China | 6.2 | Raise 2025 electrified car sales to ~25% |
| 12 | FAW | China | 3.5 | Launch 15 all-electric model by 2025 |
| 13 | Dongfeng | China | 2.9 | EV to account for 30% of its sales in 2022 |
| 14 | GAC Group | China | 2.1 | EVs to contribute 10% of its annual sales in 2020 |
| 15 | Changan Automobile | China | 1.8 | Halt sales of ICE vehicles and realise complete electrification on all products by 2025 |
| 16 | Geely | China | 0.7 | Sell 2 million vehicles annually; 90% electric by 2020 (65% hybrid, 35% pure EVs) |
Source: IndoPremier Research
Nickel in batteries
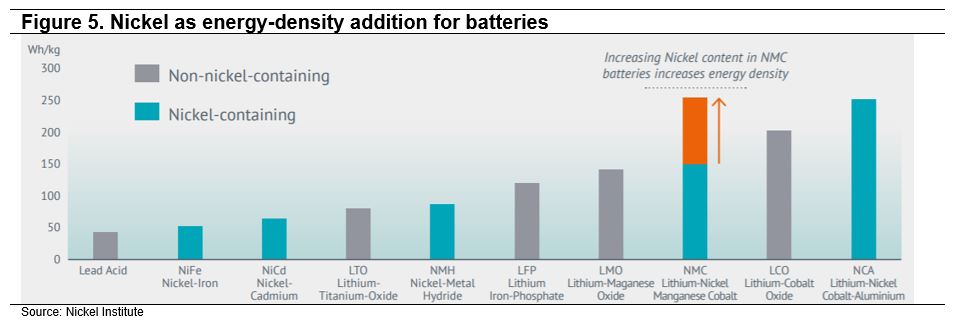
As the shift towards non-combustible engine gains traction, so will demand for raw materials including those used in EV batteries. Nickel for instance is expected to see projected annual demand rev up by at least 35% between now and 2030, according to an International Energy Agency (IEA) estimate (Figure 4). Nickel provides high-energy density and storage at lower costs (compared to cobalt) as well as longer driving range (Figure 5) and is often used in what is known as NMC (nickel, manganese, cobalt) batteries versus LFP (lithium, iron, phosphate) batteries.
Figure 4. Nickel demand by segments (kilo tonnes)
| Nickel demand by segments (k tonnes) | FY19 | % of total | 2030F | % of total | CAGR |
| Stainless Steel | 1,827 | 70% | 2038 | 56% | 1.0% |
| Plating and other alloys | 626 | 24% | 561 | 15% | -1.0% |
| Batteries | 65 | 2% | 932 | 26% | 34.4% |
| Others | 92 | 4% | 101 | 3% | 1.0% |
| Total | 2,610 | 100% | 3,632 | 100% | 3.7% |
Source: IEA
LFP vs NMC batteries
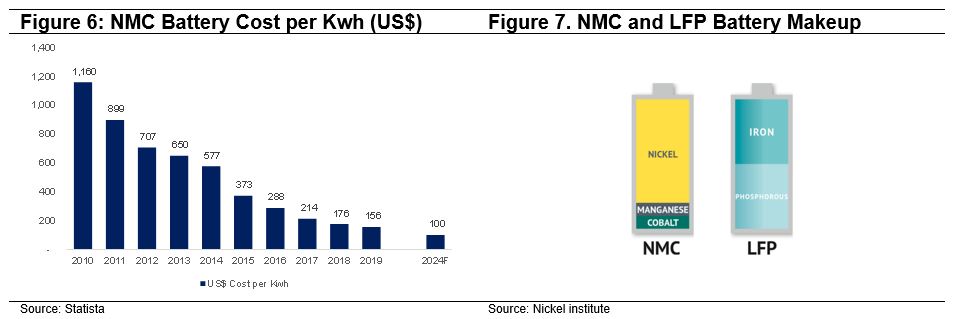
The rising demand for nickel for EV batteries has seen nickel prices shot up by 20.1% between August 2020 and February 2021, partly due to the scarcity of nickel. That presents a shortcoming despite the downward trend of battery costs as that means the NMC battery accounts for 35-40% of the costs of an EV which is at a competitive cost disadvantage compared to EVs that uses LFP batteries.
LFP batteries while not as efficient and energy dense as nickel-based batteries have the advantage in that there is plentiful supply of iron and lithium and hence more scalable at a more competitive price at about 43% less than NMC batteries. That’s one of the reasons why the leading US EV manufacturer, Tesla has opted for LFP batteries for its Model 3 cars in China, partly also to tap government subsidies. Initially priced at 300,000 yuan, that has since dropped by 20-25% to about 249,900 Yuan or about US$36,800.
LFP does have its downsides in terms of performance and durability. With an energy density at 65-70% compared to that of NMC batteries, the battery would need to be 33% bigger to achieve the same driving range. That would affect a vehicle’s balance and explains why LFP batteries are employed for standard base models. Second, the charging capabilities of a LFP battery is limited as they cannot be charged to 100% in cold weather. The attractive price proposition however means that EVs with LFP batteries may find more traction in more moderate climates such as Southeast Asia.
Overall, both battery technologies are equally valid for different conditions – NMC for higher-end products; and LFP for basic models offered at a lower-price though both NMC and LFP technology will only get better and cheaper in the long-term, which offers more attractive price points for consumers.
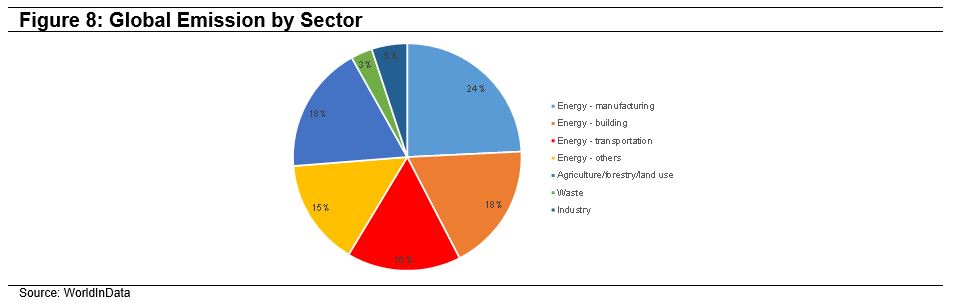
With increasing EV fleets on the roads, that will also drive both public and private sectors to raise investment in EV infrastructures such as charging stations. Such developments can only be beneficial for sustainability as transport make up 16% of global emissions especially when personal transportation is an area that individuals can have a direct choice and impact.
Nickel long-term fundamentals still intact
Given the highest energy density and hence longer driving range, nickel is expected to play a big role in the development of EVs especially if it can lead to lower overall infrastructure costs by way of charging stations. Global supply and demand is still pointing to a nickel supply deficit and the medium-term outlook should still point to a brighter outlook.
Figure 9: Global Nickel Supply Demand
| 2012 | 2013 | 2014 | 2015 | 2016 | 2017 | 2018 | 2019 | 2020 | |
| Nickel supply mined yoy % |
2,246 |
2,457 9.4% |
1,997 -18.7% |
1,999 0.1% |
1,856 -7.2% |
2,047 10.3% |
2,259 10.4% |
2,477 9.7% |
2,204 -11.0% |
| Refined nickel production yoy % |
1,777 |
1,929 8.6% |
1,871 -3.0% |
1,867 -0.2% |
1,912 2.4% |
2,066 8.1% |
2,245 8.7% |
2,395 6.7% |
2,408 0.5% |
| Refined nickel consumption yoy % |
1,676 |
1,972 17.7% |
1,893 -4.0% |
2,033 7.4% |
2,169 6.7% |
2,344 8.1% |
2,549 8.7% |
2,622 2.9% |
2,508 -4.3% |
| Refined nickel surplus (deficit) | 101 | (42) | (22) | (165) | (257) | (278) | (304) | (227) | (99) |
| yoy % | -141.6% | -47.6% | 650.0% | 55.8% | 8.2% | 9.4% | -25.3% | -56.4% | |
| LME nickel inventory (end of period) yoy % |
114 |
201 76.3% |
324 61.2% |
441 36.1% |
394 -10.7% |
379 -3.8% |
271 -28.5% |
152 -43.9% |
233 53.3% |
| Average LME nickel price (US$/tonne) yoy % |
17,499 |
14,848 -15.1% |
16,731 12.7% |
11,489 -31.3% |
9,562 -16.8% |
10,505 9.9% |
13,078 24.5% |
14,161 8.3% |
13,734 -3.0% |
Source: Bloomberg NEF
It should also be noted that nickel as a commodity is not limited to NMC batteries. That is because the cathodes deployed in lithium-ion EV batteries typically have a composition of 85% nickel, 10% cobalt and 5% aluminum. Consequently, demand for nickel can only rise along with the burgeoning use of EVs. Complicating the supply-demand equation is the fact that not all nickel mined are suitable for use in batteries with the bulk being channeled to stainless steel production. Nickel sulfate is the key nickel-bearing product used by battery manufacturers but that is currently only commercially viable through extraction processes for about half of the nickel mined today.
By Adi Prabowo, Equity Research Analyst, PT UOB Asset Management Indonesia
This publication shall not be copied or disseminated, or relied upon by any person for whatever purpose. The information herein is given on a general basis without obligation and is strictly for information only. This publication is not an offer, solicitation, recommendation or advice to buy or sell any investment product, including any collective investment schemes or shares of companies mentioned within. Although every reasonable care has been taken to ensure the accuracy and objectivity of the information contained in this publication, UOB Asset Management Ltd (“UOBAM”) and its employees shall not be held liable for any error, inaccuracy and/or omission, howsoever caused, or for any decision or action taken based on views expressed or information in this publication. The information contained in this publication, including any data, projections and underlying assumptions are based upon certain assumptions, management forecasts and analysis of information available and reflects prevailing conditions and our views as of the date of this publication, all of which are subject to change at any time without notice. Please note that the graphs, charts, formulae or other devices set out or referred to in this document cannot, in and of itself, be used to determine and will not assist any person in deciding which investment product to buy or sell, or when to buy or sell an investment product. UOBAM does not warrant the accuracy, adequacy, timeliness or completeness of the information herein for any particular purpose, and expressly disclaims liability for any error, inaccuracy or omission. Any opinion, projection and other forward-looking statement regarding future events or performance of, including but not limited to, countries, markets or companies is not necessarily indicative of, and may differ from actual events or results. Nothing in this publication constitutes accounting, legal, regulatory, tax or other advice. The information herein has no regard to the specific objectives, financial situation and particular needs of any specific person. You may wish to seek advice from a professional or an independent financial adviser about the issues discussed herein or before investing in any investment or insurance product. Should you choose not to seek such advice, you should consider carefully whether the investment or insurance product in question is suitable for you.
UOB Asset Management Ltd Co. Reg. No. 198600120Z