

- Latest US numbers point to moderating inflation and still-strong employment
- The pause in US interest rates further adds to hopes that a deep global recession can be avoided
- However, given liquidity and other risks, we remain neutral on global equities
Glass half empty, glass half full
After 10 consecutive rate hikes since March 2022, the US Federal Reserve finally took a breather this week. But Fed Chair Jerome Powell warned that this was not the end of the story, and simply a break to better assess the situation. In fact, to get inflation closer to the Fed’s 2 percent target, Powell signalled that more rate hikes may be needed before year-end, even though the pace of hikes was now less important.
Analysts note that Powell speech was masterfully both hawkish and dovish at the same time. Coupled with mixed inflation data also released this week, investors seem to be moving in many different directions.
Equity investors seem more willing to be optimistic, with the S&P 500 up by 5.7 percent over the past month. The futures market too is sceptical about more rate hikes this year and continues to forecast rate cuts next year.
In contrast, bond investors seem more focused on the possibility of future rate hikes. After the Fed announcement, 2-year US Treasury yields gained 7.9 basis points to reach a three-month high of 4.78 percent, while 10-year yields rose for the third time this week to 3.84 percent.
Figure 1: 2Y and 10Y Treasury yields, March 2023 – June 2023
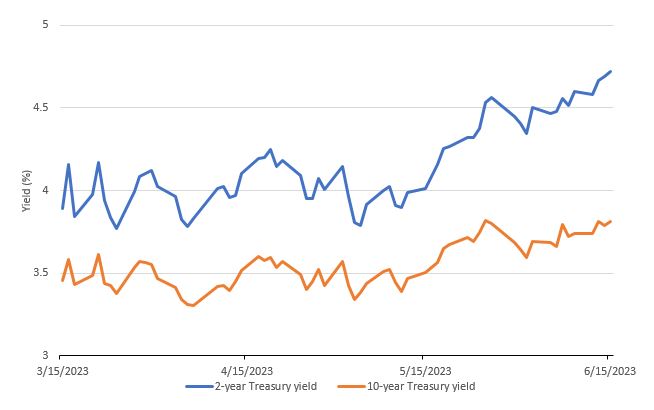
Source: Bloomberg, data as of 15 June 2023
Two-speed Inflation
Much of the Fed’s interest rate announcement was underpinned by this week’s US inflation data. Not surprisingly, the two-tone approach to interest rates reflects concerns about the US’s two-speed inflation picture.
On the one hand, annual headline inflation (that is, inflation figures including food and energy prices) has fallen to 4 percent. This is its slowest rise in over two years, driven by the softening in energy prices. Over the past year, WTI Crude prices have almost halved from close to US$120 per barrel to about US$70 per barrel1.
On the other hand, core inflation (that is, excluding food and energy), at 5.3 percent year-on-year, seems to be what is keeping Fed officials up at night. Month-on-month, May’s level is 0.4 percent higher than April. A drill down into the drivers of this rise point to three items: shelter, used car prices and motor vehicle insurance.
Inflation data may be lagging
Given the outsized contribution from these three sectors, we have been carefully monitoring their path for many months. We would note that there is a divergence between the formal data as shown by the US Consumer Price Index (CPI) versus that provided by independent sources.
For example, shelter is the largest factor contributing to inflation stickiness. However, more targeted indices from Zillow, a widely-used source of housing data, point to far weaker rental prices than indicated by current CPI data.
Figure 2: US Rent CPI vs Personal Consumption Expenditures (PCE) Price Index vs Zillow Rent index, May 2020 – April 2023
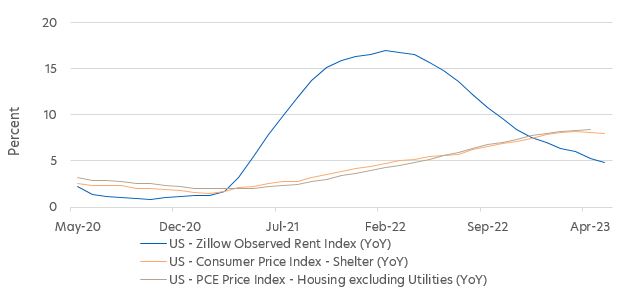
Source: MacroMicro
Similarly, the Mannheim index, which tracks more than 5 million used car transactions annually, is showing that prices have peaked.
Figure 3: Mannheim used vehicle value index, May 2023
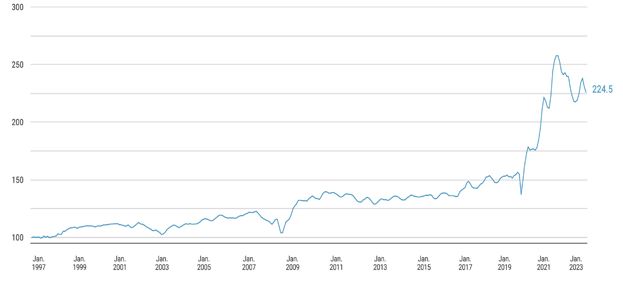
Source: Mannheim Consulting
It appears therefore that there is room for inflation surprises on the downside. This would enable the Fed to further delay interest rate hikes or halt hikes altogether.
Liquidity risks ahead
Despite this potential for good news, some equity risks remain. In particular, post-agreement to raise the debt ceiling, US lawmakers are now faced with a possible super-sized drain on liquidity.
Having drawn down the Treasury General Account from around US$580 billion earlier this year to less than US$40 billion as of May 30, the US Treasury Department must now top this up again. They are likely to do this by issuing short term Treasury bills. Altogether, new bill issuances are expected to reach about US$1 trillion before the end of August and US$1.4 trillion by the end of 2023.
Rather than keeping their money in bank deposits, individuals and businesses may choose to buy these bills instead. Given that there is also a Quantitative Tightening (QT) programme in place, there are justifiable fears that liquidity could be drastically reduced, thereby threatening the US financial system. In a worst-case scenario, this could result in a bank run not unlike that seen with Silicon Valley Bank.
Of course, the Treasury department will be watching the situation carefully and have the tools to moderate its worst effects. Many think, for example, that the current QT exercise could be paused or stopped.
Neutral call on global equities
Nevertheless, these near term uncertainties should cause investors to limit their aggressiveness in the equity markets. We perceive that there will be more broad based equity opportunities closer to the end of the year, and already the upside risks appear to outweigh the downside risks.
As such, for those investors only holding fixed income investments, they may want to consider adding more equity exposure up to a neutral level that is in sync with their risk profile. That said, investors may not want to go overboard given that equity risks remain over the near term.
1Oil price.com as of 14 June, 2023
This publication shall not be copied or disseminated, or relied upon by any person for whatever purpose. The information herein is given on a general basis without obligation and is strictly for information only. This publication is not an offer, solicitation, recommendation or advice to buy or sell any investment product, including any collective investment schemes or shares of companies mentioned within. Although every reasonable care has been taken to ensure the accuracy and objectivity of the information contained in this publication, UOB Asset Management Ltd (“UOBAM”) and its employees shall not be held liable for any error, inaccuracy and/or omission, howsoever caused, or for any decision or action taken based on views expressed or information in this publication. The information contained in this publication, including any data, projections and underlying assumptions are based upon certain assumptions, management forecasts and analysis of information available and reflects prevailing conditions and our views as of the date of this publication, all of which are subject to change at any time without notice. Please note that the graphs, charts, formulae or other devices set out or referred to in this document cannot, in and of itself, be used to determine and will not assist any person in deciding which investment product to buy or sell, or when to buy or sell an investment product. UOBAM does not warrant the accuracy, adequacy, timeliness or completeness of the information herein for any particular purpose, and expressly disclaims liability for any error, inaccuracy or omission. Any opinion, projection and other forward-looking statement regarding future events or performance of, including but not limited to, countries, markets or companies is not necessarily indicative of, and may differ from actual events or results. Nothing in this publication constitutes accounting, legal, regulatory, tax or other advice. The information herein has no regard to the specific objectives, financial situation and particular needs of any specific person. You may wish to seek advice from a professional or an independent financial adviser about the issues discussed herein or before investing in any investment or insurance product. Should you choose not to seek such advice, you should consider carefully whether the investment or insurance product in question is suitable for you.
UOB Asset Management Ltd. Company Reg. No. 198600120Z