Key Highlights
- Inflation and stagflation concerns are weighing down markets
- Investors are caught between fears of over-tightening and under-tightening
- Traditional assets remain under pressure, but select equity and alternative sectors may outperform
Rising inflation expectations
The Russia-Ukraine war continued its relentless march this week and with it has come a weakening of US equities, alongside already struggling bond markets.
Underpinning this poor sentiment are fears that inflation remains untamed, and stagflation (that is, high inflation within a stagnating economy) could become a reality. US inflation, as measured by the Consumer Price Index (CPI), is already at its highest level in 40 years, but markets worry that the peak is not yet in sight.
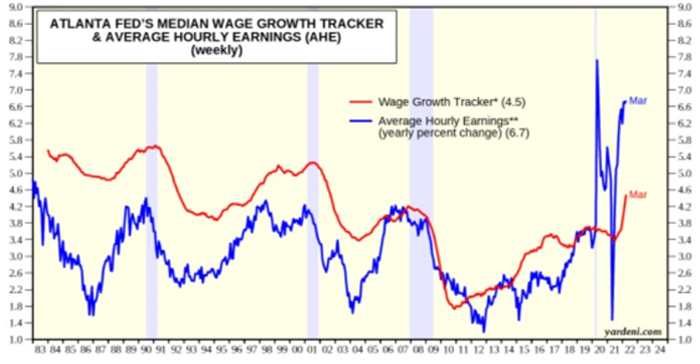
This is because longer term inflationary pressures are still being detected. For example, US wages and hourly earnings appear to be trending up strongly. Home prices have also increased 13 percent year-on-year.
Fig 1: Atlanta Fed’s Median Wage Growth Track

Source: Yardeni Research
As a result, US breakeven rates continue to climb. Breakeven rate is the yield differential between traditional and inflation-adjusted Treasuries, and a measure of inflation expectations over coming years. Last week, the US 10-year breakeven rate breached 3.0 percent, close to a record high.
Aggressive rate hikes
To counter this, the US Federal Reserve has already announced aggressive rate hike plans with seven rate rises penciled in for 2022 and four more in 2023. On top of this, the Fed has signalled that its upcoming quantitative tightening (QT) schedule will be far quicker than previous ones. Having amassed US$9 trillion on its balance sheet, the Fed is now aiming to reduce this by US$95 billion a month, a target to be reached within three months of its May start date. In its previous 2017 - 2019 QT cycle, the Fed’s US$50 billion-a-month reduction was targeted to be reached only after a year of starting.
Despite this, many investors remain unconvinced that enough is being done to bring inflation under control. In fact, these plans now only seem to fuel a vicious inflation expectations cycle. The more hawkish the Fed gets, the more nervous markets become that inflation is still raging. This in turn forces the Fed to signal even tighter policy measures.
Over the coming period, definitive signs that inflation is being contained can help break this cycle. This would allow the Fed’s policy measures to “catch up” to the market’s inflation expectations, and investors to “catch down” and digest the Fed’s policy measures.
Supply and demand mismatch
To achieve this, there is need for a greater alignment between demand and supply factors. On the one hand, there is a post-pandemic normalisation of demand, helped by the US’s high employment rate. This month’s jobless claims are at their lowest levels in over 50 years with 400,000 jobs having been added every month consecutively for the last 11 months.
On the other hand, supply normalisation has stalled. While Covid lockdowns resulted in global supply chain disruptions at ports, warehouses and shipping yards, Russian sanctions have deepened the shortage of commodities and raw materials. Meanwhile, the recent rounds of Covid curbs in China have further compounded supply constraints especially of chips and parts. Some of the largest US manufacturers and retailers are now warning that this combination of supply issues could take a toll on earnings for the rest of the year.
Can a recession be avoided?
While waiting for this supply/demand misalignment to correct, all eyes will remain on the Fed. Rate hike measures take time to flow through into the wider economy and by turning the screws too tightly and too quickly, the Fed risks halting or even reversing economic growth over the longer term. Conversely, too light a touch risks failure to dampen inflationary pressures and could eventually lead to hyperinflation. This is when inflation expectations become self-fulling and spending power is drastically eroded.
Faced with this dilemma, US policymakers may view slower but still-positive economic growth as a best case scenario. This is supported by the latest economic indicators, including the Conference Board’s Index of Leading Indicators (LEI). For March, the LEI remains positive, rising 0.3 percent but below February’s gain of 0.6 percent. The Board’s conclusion is that the US GDP in 2022 will likely slow to 3.0 percent year-on-year, compared to 5.6 percent in 2021.
Select sectors
A slow growth, high inflation environment is challenging for broad-based equity and bond markets. The recent equity market corrections suggest that investors are coming to terms with this prospect. However, despite the increased volatility, such environments erode individuals’ purchasing power, and prompt them to stay invested. This means that investors will be exercising greater discretion, but remain interested in select investment sectors that have the potential to outperform.
This includes less traditional assets that are correlated to rising inflation and sectors where demand-supply dynamics exist. It is also useful to consider global diversification into countries and regions less impacted by inflation or can benefit from rising prices.
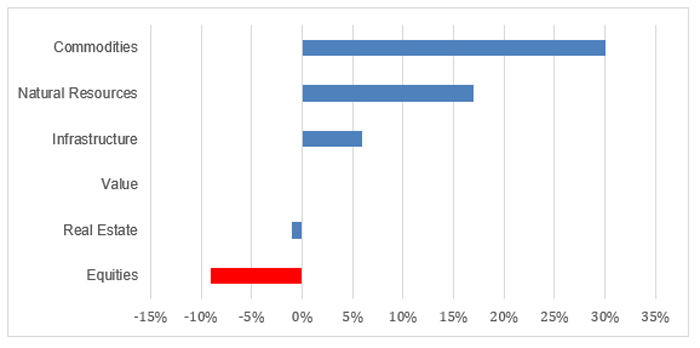
For example, since 2019, every one standard deviation increase in commodity prices has given rise to a 0.24 standard deviation increase in the value stock index and a 0.31 standard deviation increase in the global infrastructure stock index. In geographic terms. Indonesia and Australia show high sensitivity to rising commodity prices.
Fig 2: Global sector performance since equity market peak (Nov 2021 to Mar 2022)

Source: UOBAM. Commodities: S&P GSCI Index, Natural Resources: S&P Global Natural Resources Index Infrastructure: S&P Global Infrastructure Index, Value: MSCI Value Index, Global Equities: MSCI ACWI, Real Estate: FTSE EPRA Nareit Global REITS Net Total Return Index
Real and alternative assets such as REITs (real estate investment trusts), commodity-linked equities (global natural resource equities), and commodities futures also offer upside potential and diversification benefits within a multi-asset portfolio. REITS have been found to be a good hedge against inflation even in a slow growth economy because property developers have the ability to charge higher rents and yet are less tied to the business cycle.
Meanwhile, commodity producers are likely to continue to benefit from the demand-supply dynamics exacerbated by the Russia-Ukraine conflict, and can be expected to do well so long as growth continues to hold up.
This publication shall not be copied or disseminated, or relied upon by any person for whatever purpose. The information herein is given on a general basis without obligation and is strictly for information only. This publication is not an offer, solicitation, recommendation or advice to buy or sell any investment product, including any collective investment schemes or shares of companies mentioned within. Although every reasonable care has been taken to ensure the accuracy and objectivity of the information contained in this publication, UOB Asset Management Ltd (“UOBAM”) and its employees shall not be held liable for any error, inaccuracy and/or omission, howsoever caused, or for any decision or action taken based on views expressed or information in this publication. The information contained in this publication, including any data, projections and underlying assumptions are based upon certain assumptions, management forecasts and analysis of information available and reflects prevailing conditions and our views as of the date of this publication, all of which are subject to change at any time without notice. Please note that the graphs, charts, formulae or other devices set out or referred to in this document cannot, in and of itself, be used to determine and will not assist any person in deciding which investment product to buy or sell, or when to buy or sell an investment product. UOBAM does not warrant the accuracy, adequacy, timeliness or completeness of the information herein for any particular purpose, and expressly disclaims liability for any error, inaccuracy or omission. Any opinion, projection and other forward-looking statement regarding future events or performance of, including but not limited to, countries, markets or companies is not necessarily indicative of, and may differ from actual events or results. Nothing in this publication constitutes accounting, legal, regulatory, tax or other advice. The information herein has no regard to the specific objectives, financial situation and particular needs of any specific person. You may wish to seek advice from a professional or an independent financial adviser about the issues discussed herein or before investing in any investment or insurance product. Should you choose not to seek such advice, you should consider carefully whether the investment or insurance product in question is suitable for you.


