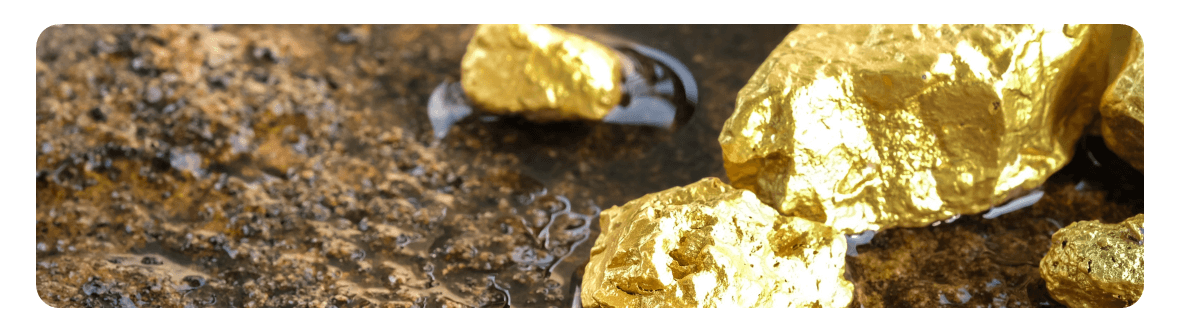
It has been a stellar year for gold and other precious metals. Despite correcting in October, precious metal prices rallied again this week. Altogether, gold prices have risen by over 50 percent, and silver by over 60 percent so far this year. Over the same period, gold and silver mining stock returns have almost doubled.1
We asked George Cheverly, Portfolio Manager for the United Gold and General Fund, whether this momentum is sustainable going into the new year, especially given October’s price dip.

George Cheverly, Portfolio Manager and Metals and Mining Specialist, Ninety One Natural Resources Team
1. Do you expect gold prices to continue their upward trajectory in 2026?
We saw a pull-back in the price of gold last month when the USD strengthened slightly and investors took profit from their gold ETFs. However, gold rallied this week on news of an end to the US government shutdown. In general, we see any gold price weakness to be temporary and in our view, the three key drivers of gold price increases remain largely intact:
- Central banks around the world continue to allocate to gold as they diversify holdings away from US treasuries, given concerns over the level of US debt and fiscal deficits. In fact, for the first time since 1996, a higher percentage of international reserves is currently held in gold rather than US Treasuries.
- Geopolitical and inflation risks continue to be high. Gold is seen as a hedge against such uncertainties because it is deemed as a stable store of value relative to paper currencies.
- The Fed is now cutting interest rates and other G7 central banks are likely to follow suit. Gold typically gains when the real rates of return decline because the income benefits of holding the US dollar is lessened.
2. Silver prices have also been soaring. Why is this?
The drivers for silver demand are somewhat different from gold. Silver’s good conductivity gives it real-world application within a wide range of new and cutting-edge products such as semiconductors, EV batteries, solar panels and medical devices.
In addition, silver like gold, is a prized possession when made into jewellery and bullion coins, but is considerably cheaper, especially given the recent gold rush. It is therefore more affordable to mass retail consumers. All this has resulted in more demand for silver than silver miners are able to supply, and silver prices have nearly tripled over the past five years.
3. Where do you see gold and silver prices headed in 2026?
Our view is that gold prices will likely remain around US$4,000 per oz or move higher through 2026. We think a fall back below US$3,500 per oz is far less probable and expect to see volatility remaining similar to current levels.
Whilst gold prices will most likely rise in 2026, they are unlikely to do so at the rate seen so far this year. Even so, we believe prices will average around $4,000/oz or more next year. This means the 2026 average will likely be about 15 to 20 percent higher than the 2025 average.
Our expectation for silver prices is similar to that of gold, with many of the same forces influencing silver prices going into 2026. Should silver prices remain at current levels then we expect silver linked equities to also perform well.
4. What is your 2026 outlook for gold and silver mining stocks?
We think current valuations for gold and silver mining stocks do not fully include recent margin improvement.
Assuming average gold prices at US $4,000 per oz next year, our models suggest that gold miners’ average free cashflow will be 10 percent or more across our portfolio holdings. Silver prices are more volatile than gold, but we anticipate a similar story for silver related equities. This suggests upside potential to current equity prices. As such, we continue to look for companies which can grow production over the next two years at similar or lower costs, thus protecting their current margins. We also believe further consolidation is needed in the precious metals industry and that we will continue to see M&A as an important driver of value.
5. What are the implications of China’s new gold policy on gold prices and gold miners?
China is currently seeking public feedback on draft regulations to streamline the licensing of gold imports and exports. By extending the validity of such licenses from six to nine months and removing limits on the number of uses per permit, China hopes to simplify the cross-border trade of gold products. If and when finalised, the new policy will likely increase demand from Chinese consumers for the precious metal.
It is also notable that Chinese central bank buying has been one of the key drivers of gold demand over recent years as China actively seeks to diversify its reserves. It is believed that these purchases are not reported in their entirety and look set to persist, with the rate of buying likely to be inversely correlated to gold prices. This will continue to benefit gold prices and related gold mining stocks.
United Gold & General Fund (the “Fund”)
What are its key features?
1. Exposure to the world’s largest miners
The Fund aims to deliver capital gains by investing primarily in gold mining companies from across the world. While gold miners make up the core (around three quarters of the portfolio), the Fund also invests in diversified mining companies as well as producers of silver, platinum, and industrial metals like copper and steel.
Fund holdings include some of the largest gold mining companies in the world, such as Newmont Corp and Agnico Eagle. However, by investing beyond just gold miners, the Fund offers investors not just access to opportunities within the wider metals and mining sector, but also better portfolio diversification.
Fig 1: Fund top 10 holdings, as of 31 October 2025
|
Name |
Weight (%) |
Description |
|
Newmont Corp |
8.64 |
World’s leading gold producer with additional copper and silver operations |
|
Gold Fields |
8.03 |
Global gold miner with assets in Africa, Australia, and the Americas |
|
Northern Star Resources |
7.18 |
Australian-based gold producer |
|
Evolution Mining |
5.24 |
Australian gold and copper producer |
|
Barrick Mining Corp |
4.68 |
Global gold and copper producer |
|
Alamos Gold |
3.81 |
Canadian gold miner |
|
Agnico Eagle Mine |
3.78 |
Canada's largest mining company and the second largest gold producer in the world |
|
Endeavour Mining |
3.28 |
Leading gold producer in West Africa |
|
Harmony Gold Mining |
3.21 |
South African gold miner |
|
Valterra Platinum |
3.00 |
South African mining company and the world’s largest primary producer of platinum |
Source: UOBAM, Morningstar, as of 31 October 2025
2. Portfolio diversification
Gold and gold mining stocks have delivered strong gains this year, but it is the Fund’s exposure to other metals that is giving it an edge.
For example, silver prices outpaced gold in September while copper prices saw strong gains on supply concerns following disruptions at Indonesia’s Grasberg mine. As a result, the Fund outperformed the NYSE Arca Gold Miners Index by around 6 percent during the month.
Diversification also proved its worth during the mid-October gold correction, when gold mining stocks pulled back. The Fund’s allocation to other metals and commodities resulted in a smaller decline of 10.06 percent compared to the index’s drop of 14.71 percent.
Fig 2: Fund returns vs gold miners index
|
|
Sep 2025 |
Oct 2025 gold price correction |
|
United Gold & General Fund |
23.65% |
-10.06% |
|
NYSE Arca Gold Miners Index |
17.35% |
-14.71% |
Source: Bloomberg, Morningstar, for the periods of 1 – 30 Sep 2025, 16 Oct – 5 Nov 2025. | Refers to United Gold & General Fund – Class A SGD Acc | Fund performance is calculated on a NAV to NAV basis. Past performance is not necessarily indicative of future performance. | Does not include the effect of the current subscription fee that is charged, which an investor might or might not pay.
3. Higher reward, higher risk
The Fund has delivered exceptional performance. Its gains year-to-date stands at an impressive 92 percent, and over the last three years, the Fund has delivered 36 percent annual returns. This is even higher than the rise in metal prices, because miners offer operating leverage. This means that when commodity prices rise above a certain threshold, miners' revenues increase faster than costs, leading to higher growth in margins and earnings.
However, such high returns come with higher volatility. This is because, despite the diversification across metals, exposure to commodity cycles and miners’ profitability drivers can cause fund returns to fluctuate significantly in the short term, as we saw in mid-October during the gold price correction. This makes the Fund a more volatile option compared to traditional equity or balanced funds, and underscores its high-risk classification.
Fig 3: Fund returns and volatility
|
|
Cumulative returns (%) |
Annualised returns (%) |
Risk (%) |
|
|
|
Year-to-date |
1-year |
3-year |
3-year standard deviation |
|
United Gold & General Fund |
92.49 |
66.70 |
35.74 |
28.72 |
|
Benchmark |
93.84 |
70.94 |
36.88 |
27.46 |
Source: Morningstar, as of 31 October 2025. | Refers to United Gold & General Fund – Class A SGD Acc | Benchmark: 70 percent FTSE Gold Mines Index and 30 percent MSCI ACWI Metals & Mining Index | Fund performance is calculated on a NAV to NAV basis. Past performance is not necessarily indicative of future performance. | Does not include the effect of the current subscription fee that is charged, which an investor might or might not pay.
Fund details
|
|
United Gold & General Fund, as of 31 October 2025 |
|
Investment objective |
Achieve returns on investment mainly in securities of corporations whose business is or is substantially in the mining or extraction of gold, silver or precious metals, bulk commodities, base metals of all kinds, and other commodities and it includes the mining or extraction of oil, gas, coal, alternative energy or other commodities or other minerals. |
|
Top 5 country allocation (%) |
Canada: 31.20 |
|
Top 5 sector allocation (%) |
Gold: 73.56 |
|
Fund class available |
SGD Acc A |
|
Management fee |
1.50% p.a. |
|
Subscription fee |
Up to 4% p.a. |
|
Minimum subscription / trading size |
S$1000 (initial); S$500 (subsequent) |
1Source: NYSE Arca Gold Miners Index, MSCI ACWI Select Silver Miners Investable Market Index, as of 31 Oct 2025
| If you are interested in investment opportunities related to the theme covered in this article, here is a UOB Asset Management Fund to consider: United Gold & General Fund
You may wish to seek advice from a financial adviser before making a commitment to invest in the above fund, and in the event that you choose not to do so, you should consider carefully whether the fund is suitable for you. |
MSCI Data are exclusive property of MSCI. MSCI Data are provided “as is”, MSCI bears no liability for or in connection with MSCI Data. MSCI full disclaimer at msci.com/notice-and-disclaimer-for-reporting-licenses.
All information in this publication is based upon certain assumptions and analysis of information available as at the date of the publication and reflects prevailing conditions and UOB Asset Management Ltd (“UOBAM”)'s views as of such date, all of which are subject to change at any time without notice. Although care has been taken to ensure the accuracy of information contained in this publication, UOBAM makes no representation or warranty of any kind, express, implied or statutory, and shall not be responsible or liable for the accuracy or completeness of the information.
Potential investors should read the prospectus of the fund(s) (the “Fund(s)”) which is available and may be obtained from UOBAM or any of its appointed distributors, before deciding whether to subscribe for or purchase units in the Fund(s). Returns on the units are not guaranteed. The value of the units and the income from them, if any, may fall as well as rise, and is likely to have high volatility due to the investment policies and/or portfolio management techniques employed by the Fund(s).
Please note that the graphs, charts, formulae or other devices set out or referred to in this document cannot, in and of itself, be used to determine and will not assist any person in deciding which investment product to buy or sell, or when to buy or sell an investment product. An investment in the Fund(s) is subject to investment risks and foreign exchange risks, including the possible loss of the principal amount invested. Investors should consider carefully the risks of investing in the Fund(s) and may wish to seek advice from a financial adviser before making a commitment to invest in the Fund(s). Should you choose not to seek advice from a financial adviser, you should consider carefully whether the Fund(s) is suitable for you. Investors should note that the past performance of any investment product, manager, company, entity or UOBAM mentioned in this publication, and any prediction, projection or forecast on the economy, stock market, bond market or the economic trends of the markets is not necessarily indicative of the future or likely performance of any investment product, manager, company, entity or UOBAM or the economy, stock market, bond market or economic trends of the markets. Nothing in this publication shall constitute a continuing representation or give rise to any implication that there has not been or that there will not be any change affecting the Funds. All subscription for the units in the Fund(s) must be made on the application forms accompanying the prospectus of that fund.
The above information is strictly for general information only and is not an offer, solicitation advice or recommendation to buy or sell any investment product or invest in any company. This publication should not be construed as accounting, legal, regulatory, tax, financial or other advice. Investments in unit trusts are not obligations of, deposits in, or guaranteed or insured by United Overseas Bank Limited, UOBAM, or any of their subsidiary, associate or affiliate or their distributors. The Fund(s) may use or invest in financial derivative instruments and you should be aware of the risks associated with investments in financial derivative instruments which are described in the Fund(s)’ prospectus.
This advertisement has not been reviewed by the Monetary Authority of Singapore.
UOB Asset Management Ltd Co. Reg. No. 198600120Z