

By Weber Hung, UOB Asset Management Taiwan;
Kenneth Tay and Raphael Theseira, Sustainability Office, UOB Asset Management
Sustainable Investing as an investment strategy has existed for more than a decade globally, but has only recently come to prominence in Asia. Based on a Morningstar Report, in 2020, the assets under management (AUM) of ESG funds in Asia has grown by 75% between the first and second quarters of 2020 to US$10.8 billion or a net inflow of approximately US$8.7 billion. Year-on-year growth for 2020 was a whopping 131% which marked a record for annual growth of sustainable funds in Asia.
1. High penetration of ESG in Taiwan
The sustainable funds market in Asian regions such as China and India has picked up significantly but what is most notable is Taiwan’s AUM year-on-year growth of 336%, overshadowing all its Asian peers which clearly indicates a keen interest in from investors in Taiwan for sustainable funds.
Market Summary of Sustainable Funds in Asia
| No. of locally domiciled ESG funds | No. of new launches | Net Flows ($) | Net Flows ($) | Fund size ($) | *Growth | |
| Market | As of 2020-end | Full Year 2020 | Q4 2020 | Full Year 2020 | As of 2020-end | YoY Growth |
| China | 2 | 0 | 4,908,130 | 15,891,895 | 353,172,289 | 20% |
| Hong Kong | 2 | 0 | 4,908,130 | 15,891,895 | 353,172,289 | 20% |
| India | 8 | 5 | 496,694,819 | 745,183,166 | 1,331,862,627 | 210% |
| Indonesia | 9 | 0 | (12,841,646) | 20,458,805 | 67,929,375 | -13% |
| Malaysia | 16 | 1 | (11,224,947) | 13,742,399 | 376,562,726 | 24% |
| Singapore | 3 | 0 | (350,276) | -1,243,659 | 16,749,544 | 6% |
| South Korea | 115 | 12 | 573,524,646 | 369,984,155 | 2,185,457,709 | 14% |
| Taiwan | 24 | 11 | 102,878,350 | 1,792,939,538 | 2,944,858,125 | 336% |
| Thailand | 10 | 3 | (5,483,685) | 4,886,503 | 105,818,435 | 24% |
| Asia ex-Japan Total | 268 | 43 | 5,013,657,658 | 7,868,146,903 | 25,404,726,476 | 131% |
Source: Morningstar Direct as of February 2021. *includes AUM increase due to market returns.
Research by Fitch Securities has shown that ESG funds incepted in Taiwan were diversified across different asset types such as bonds, multi-asset, stocks and Exchange-Traded Funds (ETFs). A recent report1 from Fitch Ratings also identified Taiwan to have the highest share of ESG funds and ETF assets of all markets in Asia (see chart below) at around 2% of total industry assets with a record 11 new ESG related funds launched in 2020 compared to the 3 in the previous year.
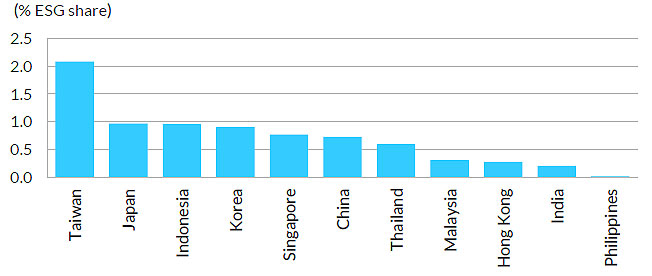
Source: Fitch Ratings, Lipper for Investment Management as at 3 February 2021
The significant growth in AUM in Taiwan can be attributed to an increase in local institutional and retail investor awareness and investment manager support for sustainable investing. A 2020 Cerulli survey of asset managers in Asia2 showed that ESG as a theme has increasingly become a key priority for managers over the next two years. Other than heightened awareness especially among young retail investors, seminars held by banks and managers are also likely to have contributed to demand.
2. Attractiveness of fixed income products
Taiwanese investors have shown a preference for fixed income products with high yield bonds and emerging market bonds being the most popular investment due to their higher yields and high dividend payout ratios compared to domestic Taiwan fixed income products which pay ultra-low yields.
3. Growing market for Sustainable Bonds in Asia
While traditional fixed income investments are traditionally popular among Taiwanese investors, the growth in a new class of sustainable debt market which includes green, social and sustainability bonds have been remarkable. Very few green bonds were issued in China before 2016, but by 2019, they accounted for 12% of global green bond issuance. As of August 2020, green, social, and sustainability bonds in Asia ex-Japan represented an outstanding amount of US$45 billion within the J.P. Morgan Asia Credit Index (JACI).
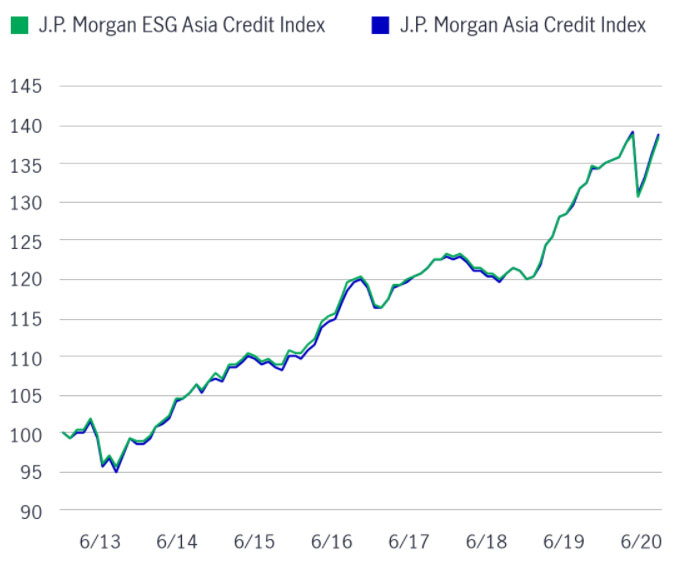
Source: Bloomberg, MSCI, August 31, 2020. Figures shown are in gross USD terms. It is not possible to invest directly in an index. Past performance does not guarantee future results
| Returns % | |
| J.P. Morgan ESG Asia Credit Index | 41.63 |
| J.P. Morgan Asia Credit Index | 41.95 |
| Difference | - 0.32 |
This accelerated growth in Asia has been driven by robust government policy and support for sustainable infrastructure and renewable energy with Hong Kong launching a multi-tranche green bond offering totalling USD 2.5 billion recently in January3; China being Asia’s largest issuer and the second-largest globally with USD 22 billion in dollar bonds and USD 96 Billion in RMB-denominated green bonds followed by India4. Strong policy support has also driven increased participation by market makers and corporates taking the opportunity to mobilise capital.
Despite the uptick in uncertainty and volatility in global markets, UOBAM Taiwan is of the opinion that there are opportunities in ESG Asia investment bonds and hopes to offer the right investment products which not only provide higher yield, but also take into account the risks and volatility to Taiwanese investors during the post COVID pandemic period.
Notes:
1 Fitch Ratings Report: ESG Emerges as an Investment Theme in Taiwan, 3 February 2021
2 Fund Selector Asia: Taiwan managers adjust fees to boost fund growth, 11 January 2021
3 The Asset, Investors pile into Hong Kong Special Administrative Region (HKSAR) second green bond, 27 January 2021
4 HSBC Global Research: Asia’s green finance booms; Investors eager for region’s dollar-denominated green bonds, 12 November 2020
This publication shall not be copied or disseminated, or relied upon by any person for whatever purpose. The information herein is given on a general basis without obligation and is strictly for information only. This publication is not an offer, solicitation, recommendation or advice to buy or sell any investment product, including any collective investment schemes or shares of companies mentioned within. Although every reasonable care has been taken to ensure the accuracy and objectivity of the information contained in this publication, UOB Asset Management Ltd (“UOBAM”) and its employees shall not be held liable for any error, inaccuracy and/or omission, howsoever caused, or for any decision or action taken based on views expressed or information in this publication. The information contained in this publication, including any data, projections and underlying assumptions are based upon certain assumptions, management forecasts and analysis of information available and reflects prevailing conditions and our views as of the date of this publication, all of which are subject to change at any time without notice. Please note that the graphs, charts, formulae or other devices set out or referred to in this document cannot, in and of itself, be used to determine and will not assist any person in deciding which investment product to buy or sell, or when to buy or sell an investment product. UOBAM does not warrant the accuracy, adequacy, timeliness or completeness of the information herein for any particular purpose, and expressly disclaims liability for any error, inaccuracy or omission. Any opinion, projection and other forward-looking statement regarding future events or performance of, including but not limited to, countries, markets or companies is not necessarily indicative of, and may differ from actual events or results. Nothing in this publication constitutes accounting, legal, regulatory, tax or other advice. The information herein has no regard to the specific objectives, financial situation and particular needs of any specific person. You may wish to seek advice from a professional or an independent financial adviser about the issues discussed herein or before investing in any investment or insurance product. Should you choose not to seek such advice, you should consider carefully whether the investment or insurance product in question is suitable for you.
UOB Asset Management Ltd Co. Reg. No. 198600120Z