

A defensive approach to investing
In Part Two of our Regular Savings Plan series, we show why dollar cost averaging (DCA) is used by long term investors as a strategy to reduce the risk of extreme negative outcomes
The concept of dollar cost averaging (DCA) was popularised by Benjamin Graham in his book “The Intelligent Investor”, written in 1949. Graham is best known as the father of value investing and is often cited as having directly influenced Warren Buffett, who was his student and employee.
In his book, Graham distinguishes between passive and active investors. According to him, the passive investor is defensive, invests cautiously, looks for value stocks, and buys for the long term. The active investor, on the other hand, is one who has more time, interest, and possibly more specialised knowledge to seek out exceptional buys in the market.
For the passive investor, Graham suggests DCA as a way to mitigate the negative effects of market volatility. This strategy involves investing a fixed amount on a regular basis, so that more units can be purchased when prices are lower, and less when prices are higher, thereby averaging out the costs. There is no market timing involved, as investments continue to be made, regardless of whether markets are rising or falling.
This may seem counter-intuitive for many investors, because the tendency is to invest all at one go, or on a very irregular basis. This is generally termed lump sum investing. By doing so, investors commit to acquiring their investments at a certain price. This forces them to try to time the market, that is, to assess when markets are at, or close to, their bottom.
Essentially, where lump sum investing is concerned, market timing is a key factor in the final outcome. However, not only is this difficult to get right, but getting it wrong can be highly detrimental to returns.
Does DCA work in less volatile markets?
To investigate this, we look at investment returns achieved in 2017, one of the least volatile years in US equity market history since the mid-1960s. We compare how three investors, Meiling, John and Sheila fared, based on SPDR S&P 500 Trust ETF month-end prices.
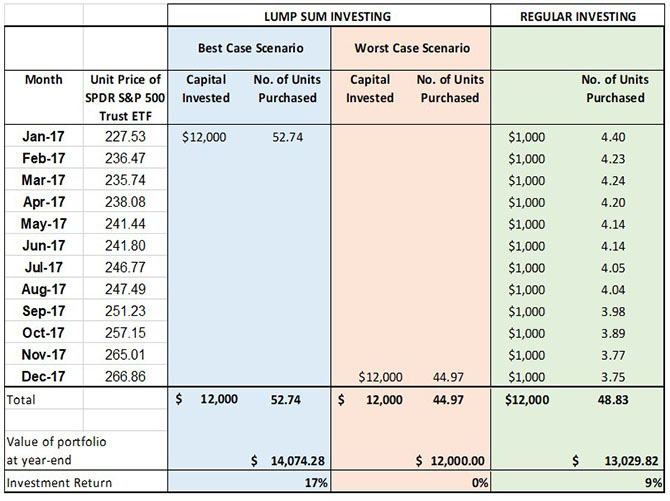
Figure 1: Lump sum vs regular investing in a less volatile market
Data Source: Yahoo Finance
Note: For illustration purposes only
Our first investor, Meiling, invests in a best case scenario ie
- She manages to invest all of her US$12,000 savings in January 2017, the lowest point in the year.
- The ETF costs just $227.53 per share and Meiling is able to acquire 52.74 shares.
- At year-end, her investment is worth $14074.28, that is, it has generated 17% profit.
John on the other hand, waits on the sidelines and finally invests the same amount, but in a worst case scenario ie
- He invests all of his US$12,000 savings in December 2017, the highest point in the year
- The ETF costs $266.86 per share, so he only manages to buy 44.97 shares.
- At year-end, his investment has broken even and generated 0% profit..
- The dispersion between the highest and lowest returns in 2017 is 17%.
A third investor, Sheila, invests an equal amount every month throughout the year ie
- She invests US$1,000 every month for 12 months, so her capital is US$12,000, the same as Meiling and John.
- However, her shares are purchased at different prices. In total, she is able to acquire 48.83 shares.
- At year-end, her investment has generated a 9% profit.
While Sheila did not achieve the maximum possible return, by adopting a DCA strategy, she was able to smooth out the impact of the market’s price volatility. By investing regularly, she reduced the risk of an extreme outcome and also did not spend any effort timing the market.
Does DCA work in highly volatile markets?
We can repeat the same exercise for one of the US market’s most volatile years – 2008.
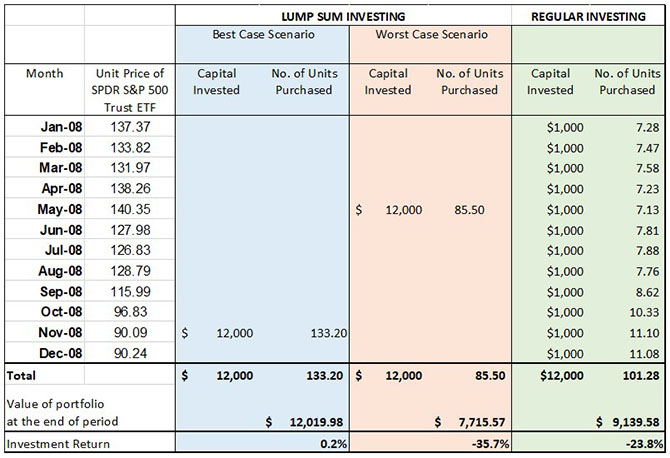
Figure 2: Lump sum vs regular investing in a highly volatile market
Data Source: Yahoo Finance
Note: For illustration purposes only
- Meiling is again able to perfectly time the market and invests her US$12,000 savings at the lowest point of the year, ie November 2008. As such, she ends the year with US$12,019.98, a return of 0.2%.
- John is again very unfortunate and invests at the highest point of the year ie May 2008. At year-end, his return is -35.7%. This means that in 2008, the dispersion in investment returns had widened to almost 36%.
- Sheila, who invests regularly throughout the year, achieves US$9,139.58 at year-end, a return of -23.8%. While this is less than the maximum positive returns she could have achieved, she has also avoided the maximum negative returns.
It’s not timing the market, but time in the market that counts
In the illustration above, we have only considered a one-year investment. However, empirical studies have found that the longer you stay invested, the greater the chances of gaining positive returns. To illustrate this, the chart below shows the likelihood of getting positive returns when making investments in the SPDR S&P500 Trust ETF between February 1993 to March 2022.
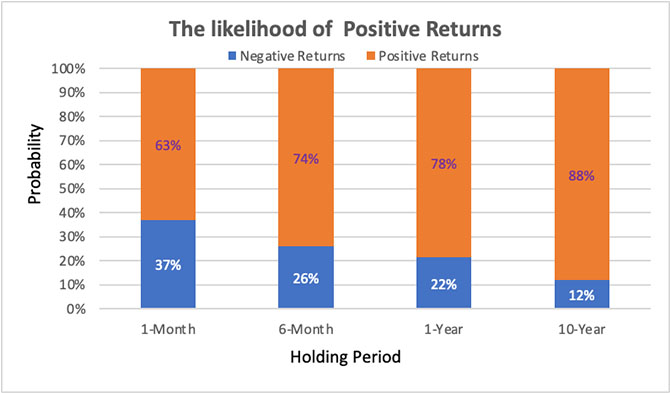
Figure 3: The likelihood of positive returns increases with time
Data Source: Yahoo Finance
As the chart shows, for a one-month investment holding period during the past 29-year period, investors have a 63% chance of making a positive. By holding an investment for one year, your chances of a positive return increase to 78%. If you extend the holding period to 10 years, your chances of a positive return increase to 88%. The amount of return over a longer holding period is also likely to be higher.
However, a long holding period is harder if you are actively timing the market. There is a greater tendency to sit out in cash while waiting for the “right” time to invest or re-invest. The other major benefit of a DCA strategy is therefore that it encourages long-term passive investing.
Unless, as Benjamin Graham suggests, you have the time, interest, and specialised knowledge to time the market (and even the experts often get it wrong), dollar cost averaging offers an alternative and more defensive approach to investing that has the potential to pay off over the long term.

This publication shall not be copied or disseminated, or relied upon by any person for whatever purpose. The information herein is given on a general basis without obligation and is strictly for information only. This publication is not an offer, solicitation, recommendation or advice to buy or sell any investment product, including any collective investment schemes or shares of companies mentioned within. Although every reasonable care has been taken to ensure the accuracy and objectivity of the information contained in this publication, UOB Asset Management Ltd (“UOBAM”) and its employees shall not be held liable for any error, inaccuracy and/or omission, howsoever caused, or for any decision or action taken based on views expressed or information in this publication. The information contained in this publication, including any data, projections and underlying assumptions are based upon certain assumptions, management forecasts and analysis of information available and reflects prevailing conditions and our views as of the date of this publication, all of which are subject to change at any time without notice. Please note that the graphs, charts, formulae or other devices set out or referred to in this document cannot, in and of itself, be used to determine and will not assist any person in deciding which investment product to buy or sell, or when to buy or sell an investment product. UOBAM does not warrant the accuracy, adequacy, timeliness or completeness of the information herein for any particular purpose, and expressly disclaims liability for any error, inaccuracy or omission. Any opinion, projection and other forward-looking statement regarding future events or performance of, including but not limited to, countries, markets or companies is not necessarily indicative of, and may differ from actual events or results. Nothing in this publication constitutes accounting, legal, regulatory, tax or other advice. The information herein has no regard to the specific objectives, financial situation and particular needs of any specific person. You may wish to seek advice from a professional or an independent financial adviser about the issues discussed herein or before investing in any investment or insurance product. Should you choose not to seek such advice, you should consider carefully whether the investment or insurance product in question is suitable for you.
UOB Asset Management Ltd Co. Reg. No. 198600120Z