With many China ETFs tracking many different China market indices, it can be hard to pick the one that best suits your needs. We compare three of the most common: the FTSE China A50, the MSCI China and the Hang Seng Stock Connect China 80
China’s market remains resilient
Despite ongoing tariff uncertainties, China’s equity market continues to show surprising resilience. Since President Trump’s tariff announcements on 2 April 2025, the Shanghai Stock Exchange (SSE) Composite Index has only declined 2.2 percent, and it is up 0.2 percent year-to-date1.
Several factors are driving China’s market resilience, including China’s reduced reliance on the US market for exports, the anticipation of a stimulus package to boost domestic consumption, and China’s pledge to stabilise its domestic stock markets, with emphasis on China A-shares.
Not all indices are the same
With the US and other markets facing considerable volatility, foreign investors may be looking to the China market for diversification opportunities. And given the challenges of stock picking, China ETFs (exchange traded funds) that track specific broad-based indices are increasingly a go-to solution for both retail and institutional investors.
But the question is: which index to choose? For example, the Singapore stock exchange (SGX) is home to several China ETFs and indices. These can differ significantly in terms of the number of stocks, stock and sector exposure, and performance in various market cycles.
Below we compare the features of three of the most prominent indices tracked by SGX-listed ETFs to help you decide which one suits you best.
1Source: Bloomberg, as of 16 April 2025
1. Broad vs targeted exposure
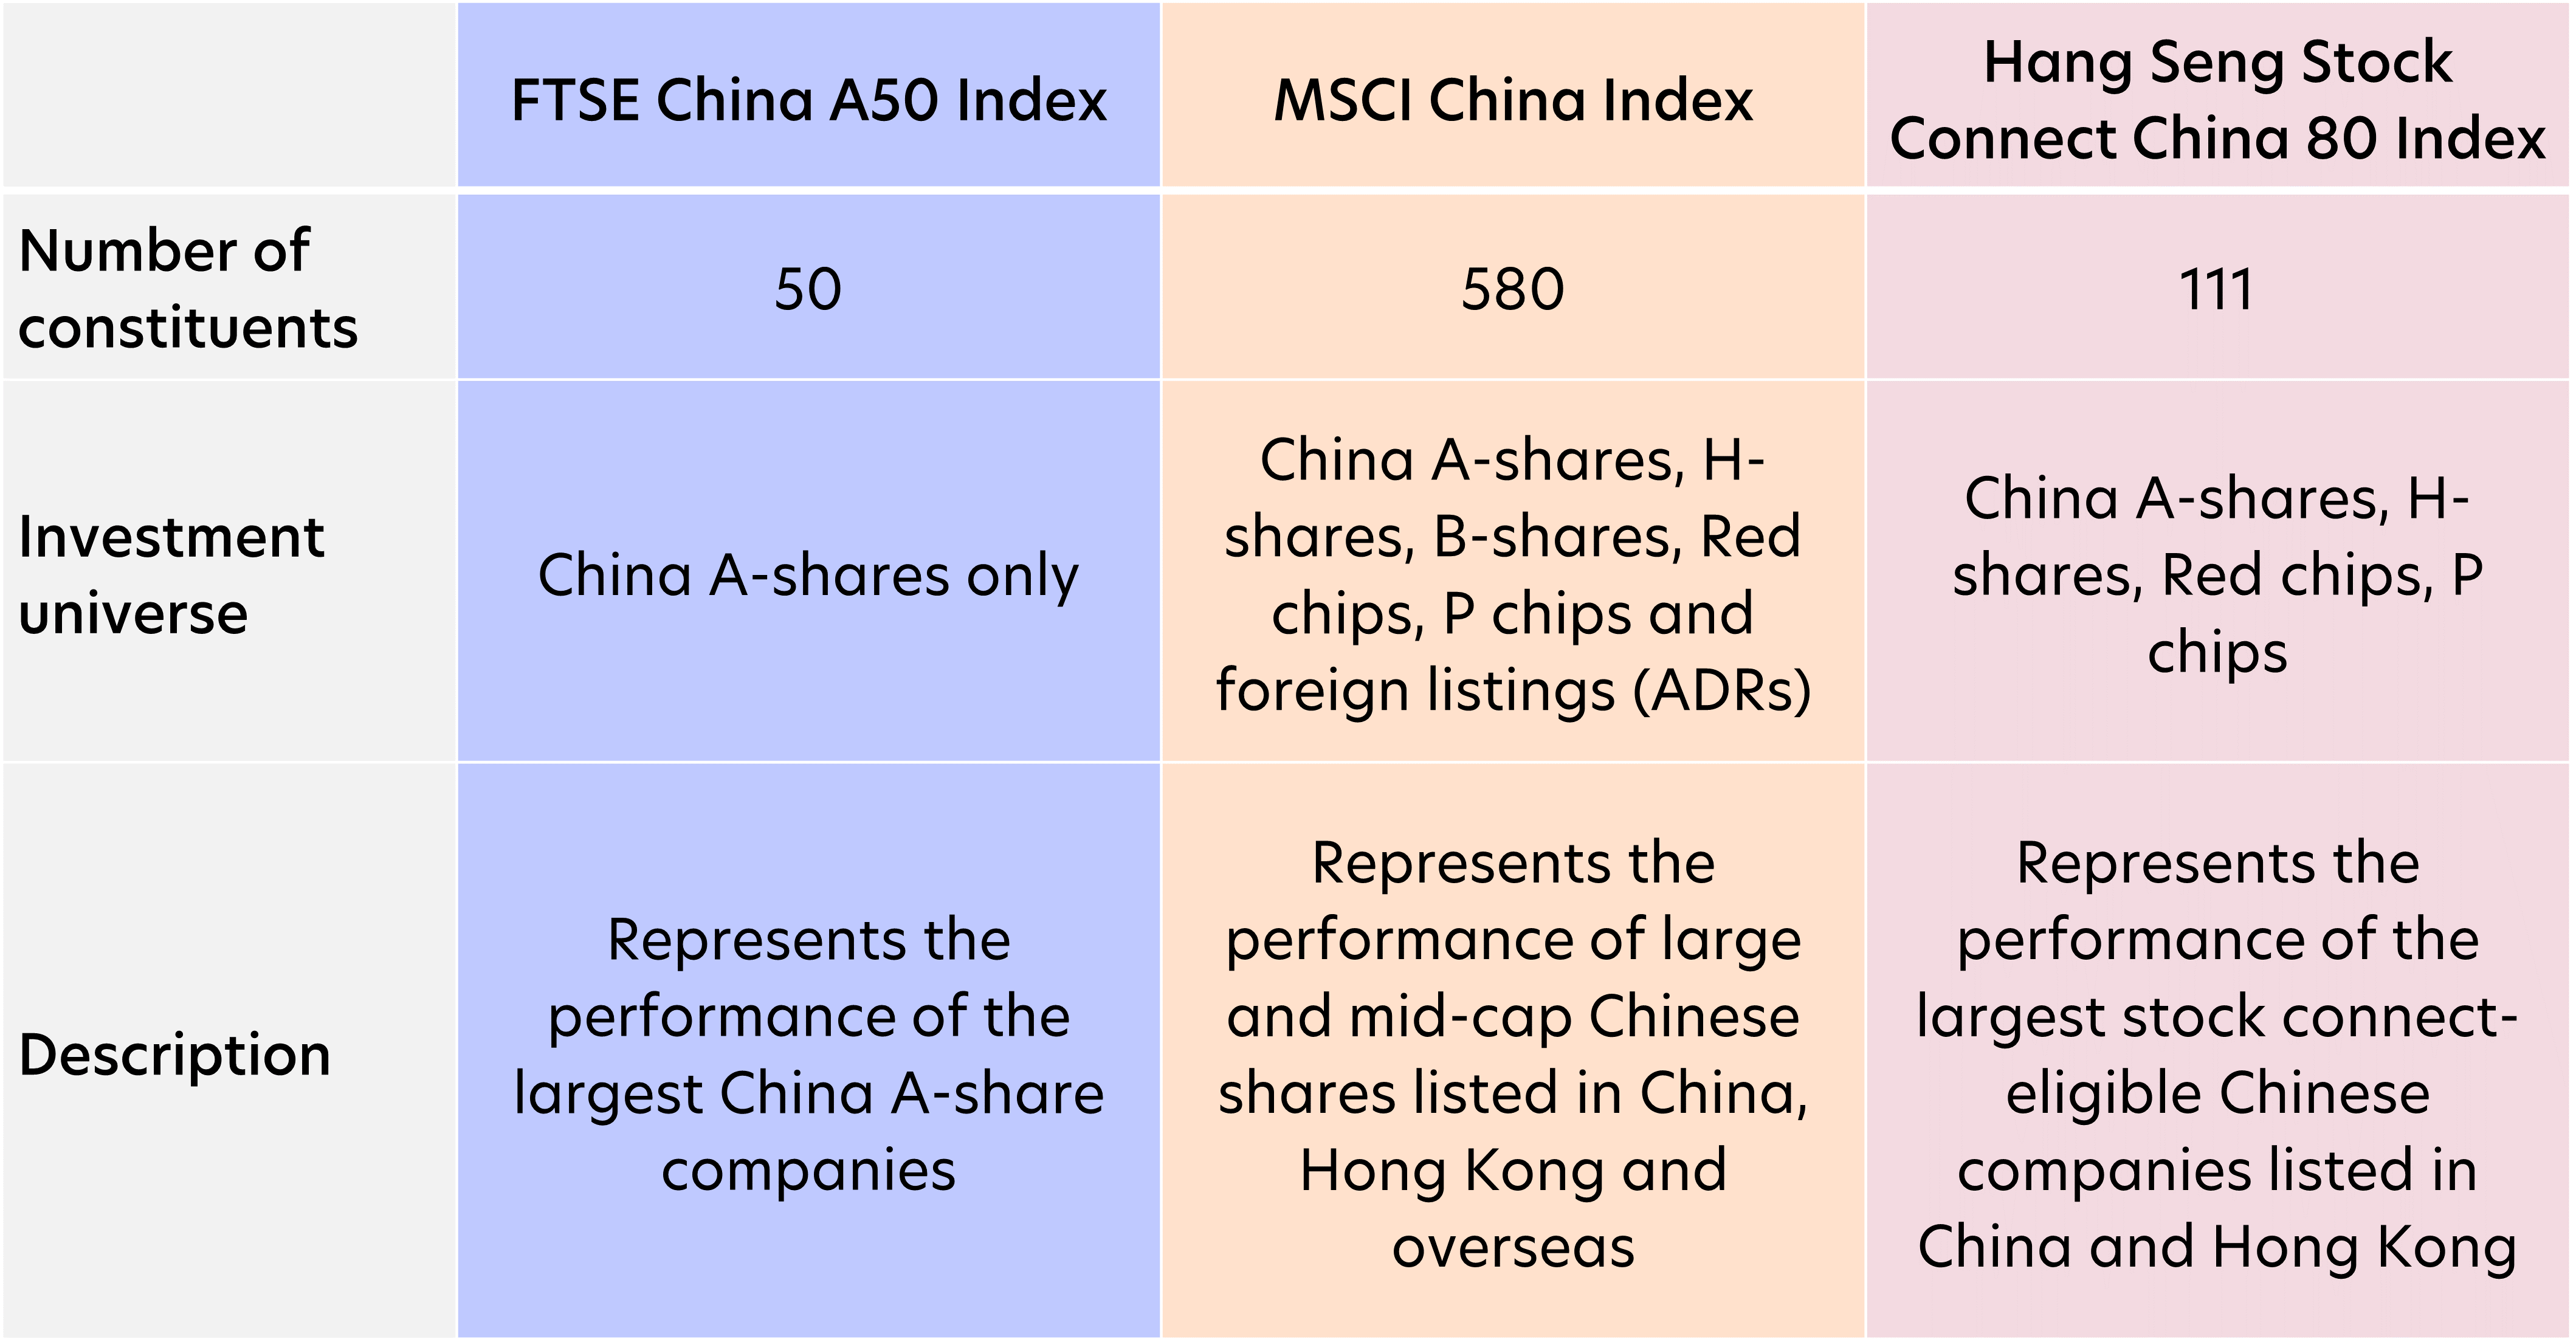
Source: Bloomberg, FTSE Russell, MSCI, as of 31 March 2025
Of the three indices under comparison, the MSCI China Index offers the broadest exposure as it includes China shares listed on the mainland (A-shares and B-shares), in Hong Kong (H-shares, Red chips, P chips) and overseas (such as American Depository Receipts (ADRs)).
The Hang Seng Stock Connect China 80 Index is more concentrated. It is comprised of the 80-or-so largest Chinese companies listed in Hong Kong and/or mainland China that are eligible for trading under the Stock Connect scheme. Launched in 2014, Stock Connect is a mutual market access programme enabling investors either in Mainland China or Hong Kong to trade and settle shares listed on the other market via the stock exchanges and clearing houses in their home market.
The FTSE China A50 Index is solely focused on China’s 50 largest A-share companies listed in Mainland China, that is, on the Shanghai Stock Exchange (SSE) and the Shenzhen Stock Exchange (SZSE), and traded in the domestic Renminbi (RMB) currency. Of the three under comparison, this index is the most representative of China’s domestic economy and makes up about one third of the entire A-share universe by weight.
2. Mega cap vs large cap vs mid cap
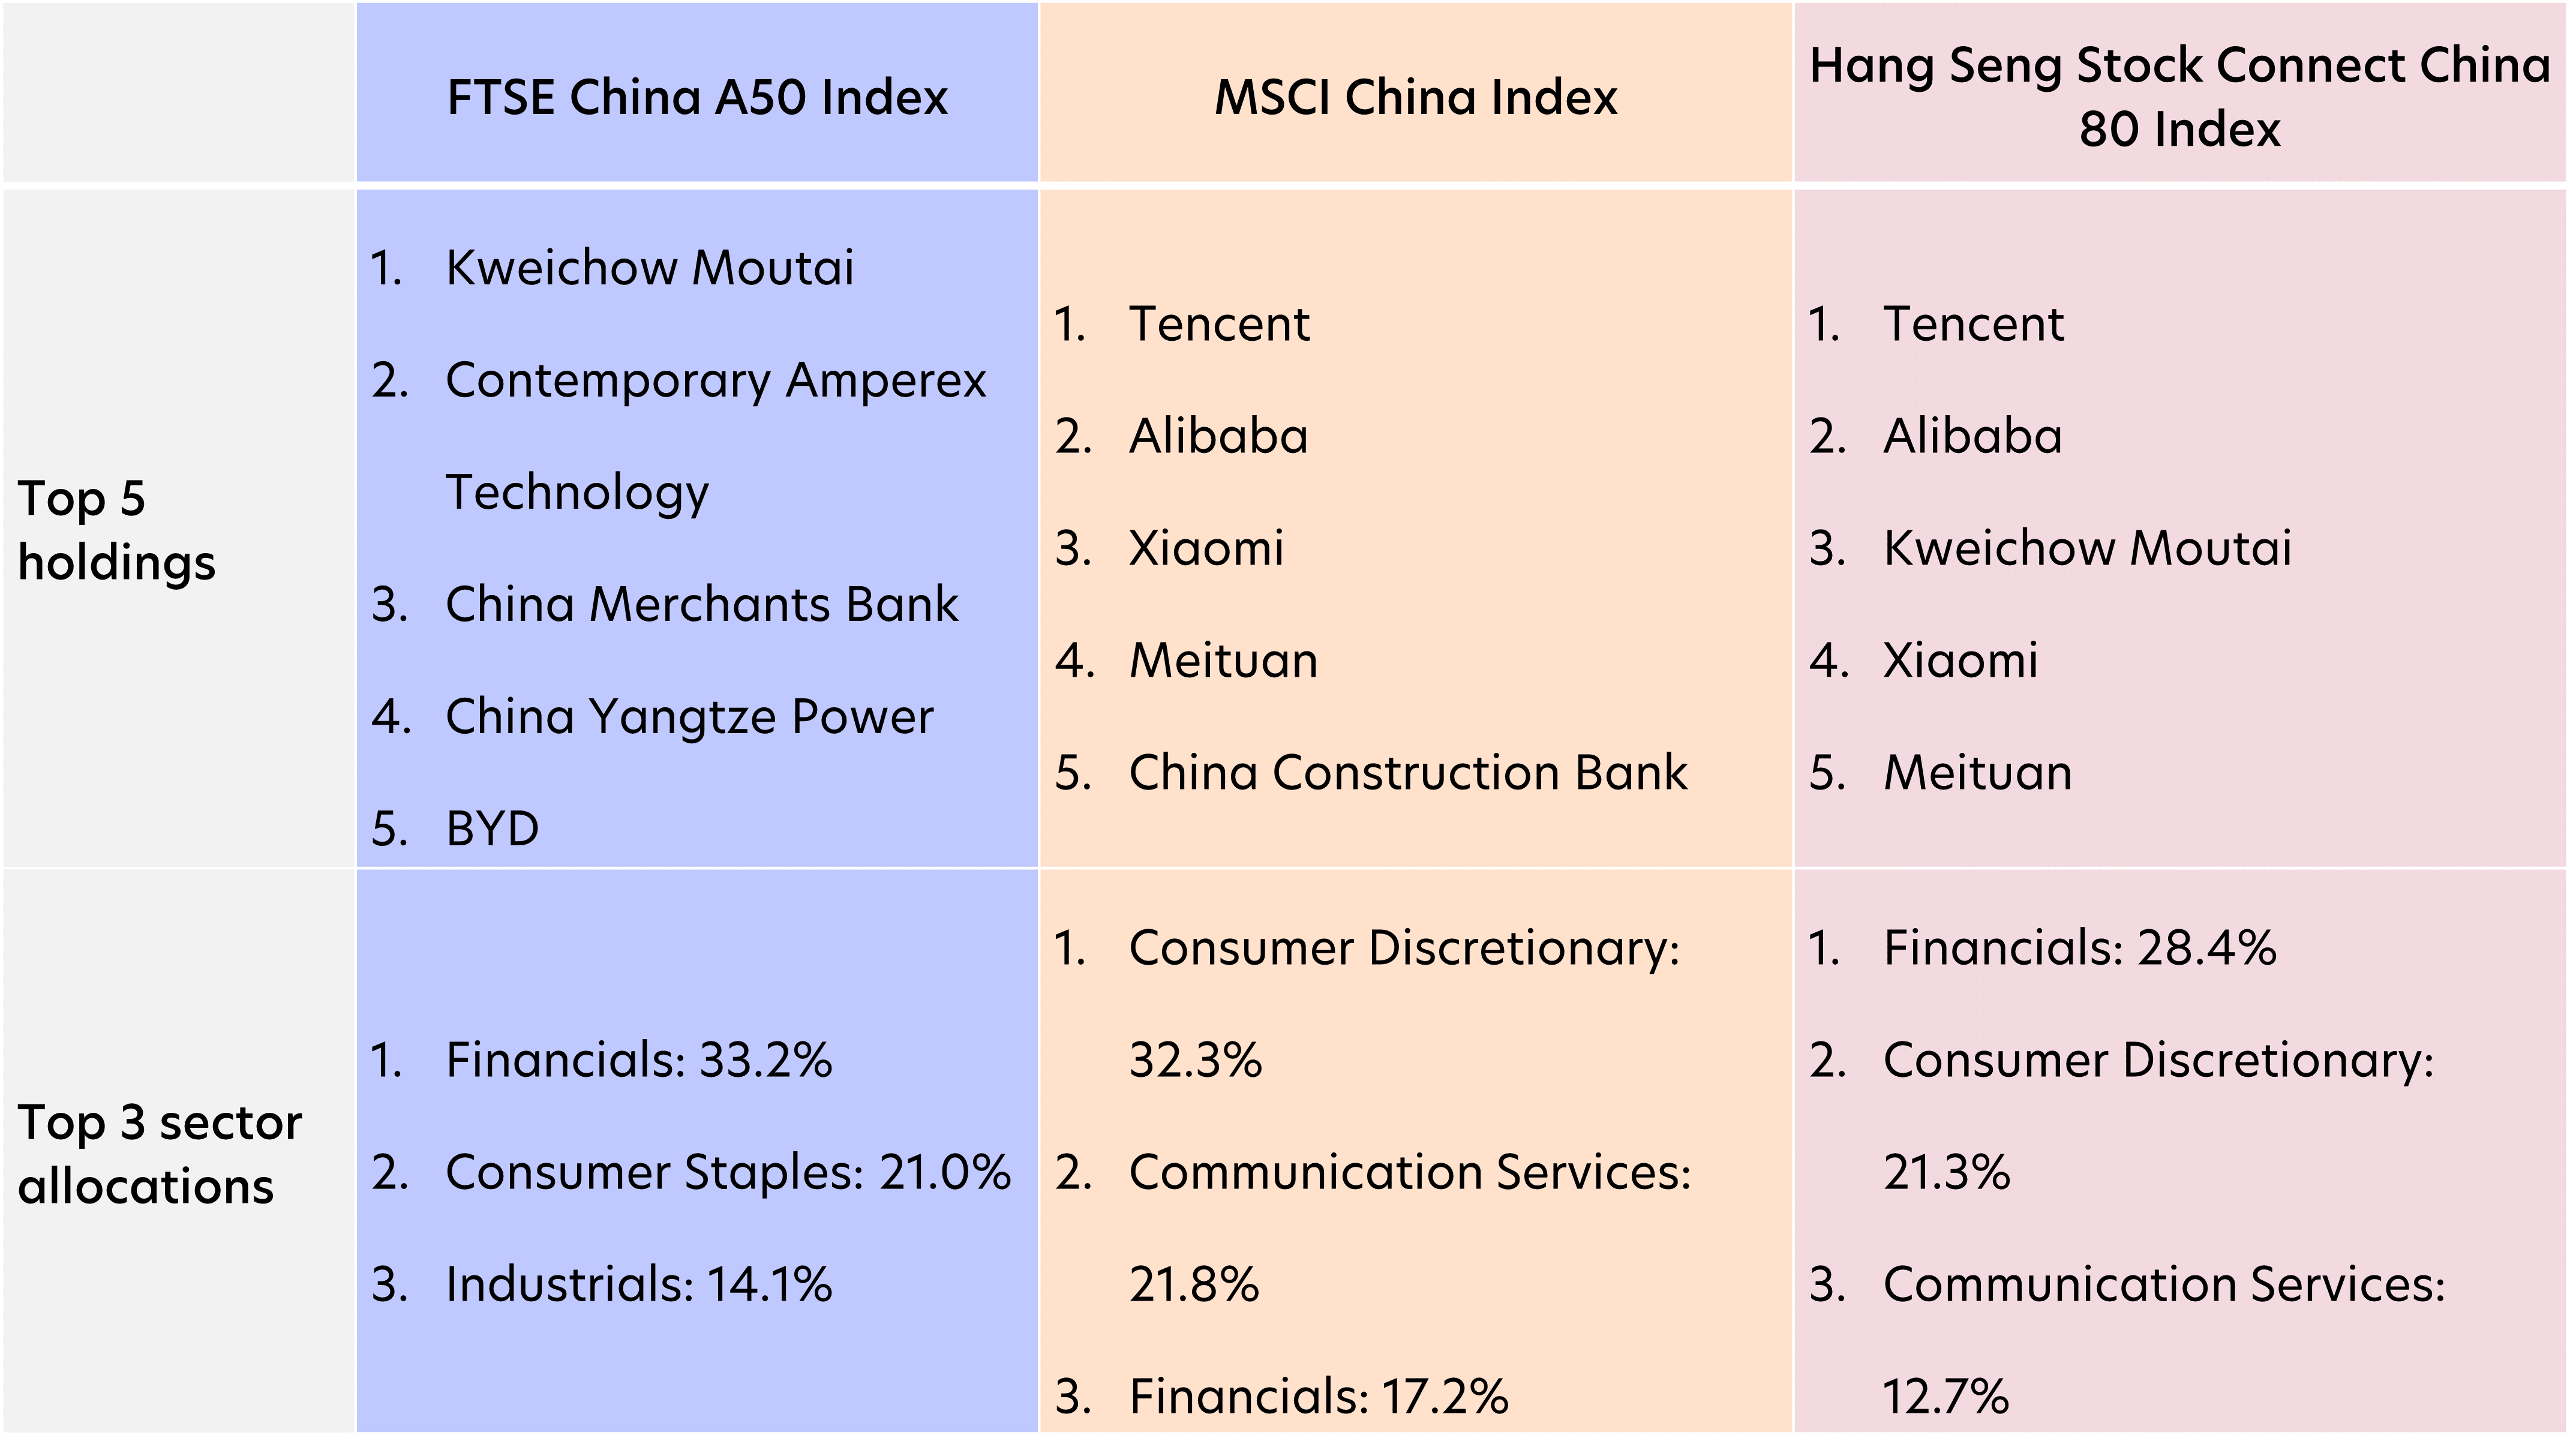
Source: Bloomberg, FTSE Russell, MSCI, as of 31 March 2025
For investors seeking exposure to megacap digital and technology companies such as Tencent, Alibaba and Meituan, these are well-represented within the Hang Seng Stock Connect China 80 Index. China’s megacap stocks, similar to the US’s Magnificent Seven, had been the focus of last year’s rallies. However, amid this year’s tariff uncertainties and high valuations, the Mag 7 stocks have seen considerable profit-taking.
Megacap tech stocks can also be found in the MSCI China Index, making up about a third of the index by weight. Additionally, over 10 percent of the index is comprised of mid-cap Chinese stocks. These smaller cap stocks have the potential to outperform during market rallies but also have a tendency to see more price volatility.
The FTSE China A50 Index offers exposure to the largest cap stocks within China’s A-share market, that is primarily companies in the consumption, industrial and financial sectors. These stocks have the biggest potential to benefit from domestic spending and state stimulus measures. Within the index’s top holdings are brands such as baijiu brewer Kweichow Moutai, electric vehicle (EV) maker BYD, and EV battery producer Contemporary Amperex Technology (CATL).
3. Return vs volatility
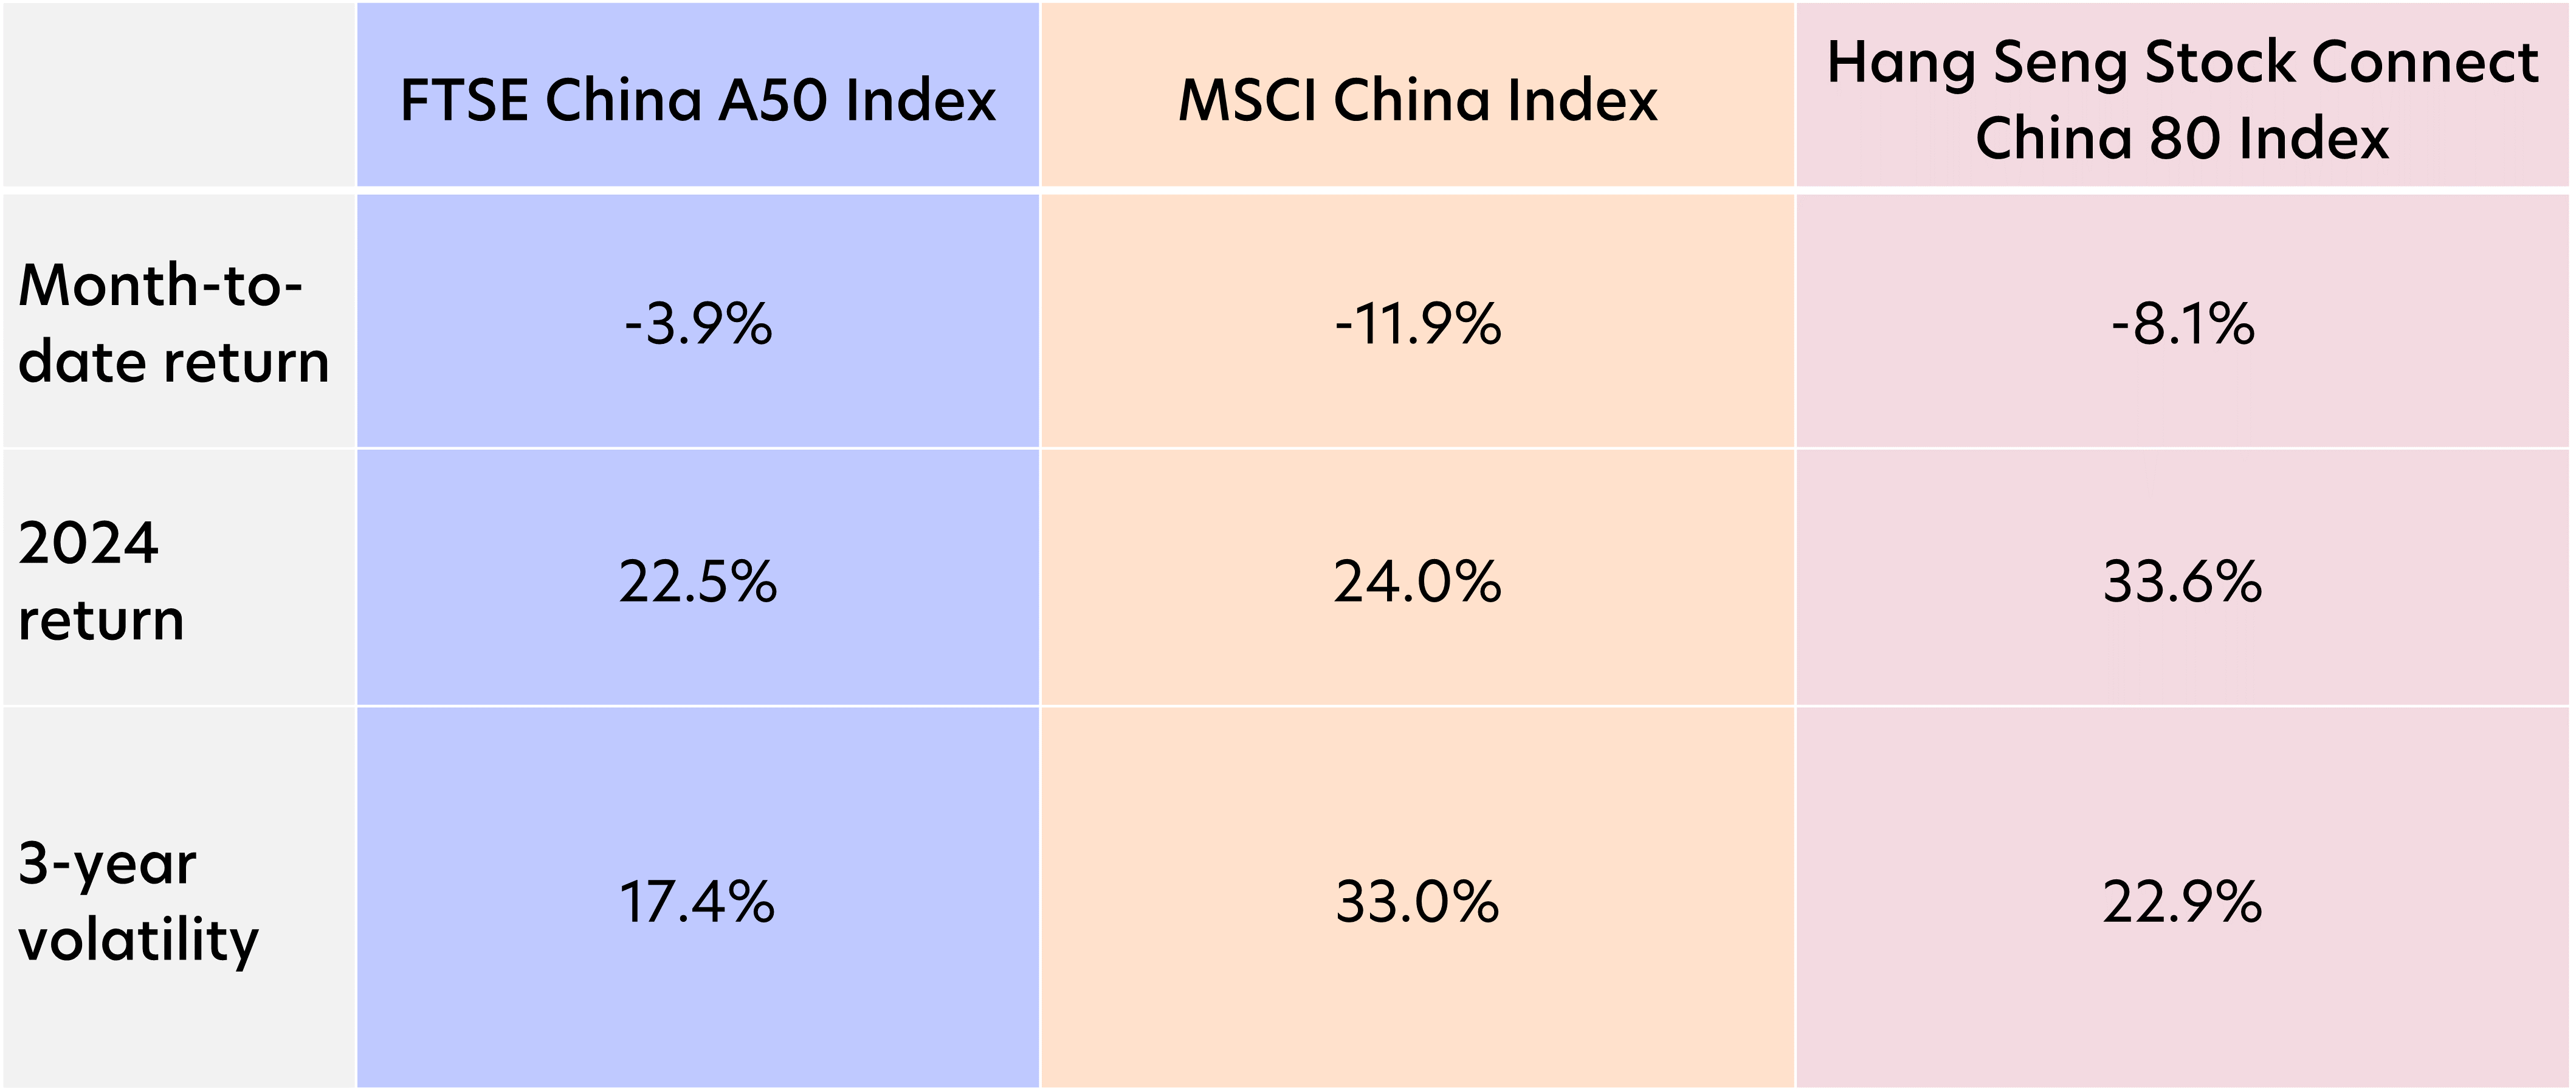
Source: Bloomberg, Morningstar, as of 16 April 2024. Figures quoted in SGD terms. Volatility for the Hang Seng Stock Connect China 80 Index is based on the Lion-OCBC Securities China Leaders ETF
The different indices have a tendency to display relatively large variations in performance across different market cycles. For example, the MSCI China Index significantly underperformed the other two indices. It also showed the greatest three-year volatility, despite its larger number of holdings and wider coverage. This is likely due to its mid-cap exposure as well as its China ADR holdings, which faced more selling pressure amid delisting fears in 2022 and the current US-China trade war.
The Hang Seng Stock Connect China 80 Index was the second-worst performer given its relative concentration in megacap tech stocks, which remain vulnerable to concerns of the US limiting Chinese access to cutting-edge technology.
The FTSE China A50 Index performed the best during the period, given its 100 percent exposure to China A-shares. Its holdings are generally more focused on China’s domestic economy and are likely to be more insulated from tariff effects. Of the three indices, the FTSE China A50 Index has also shown the lowest volatility over a three-year period, reflecting its resilience despite the current period of uncertainty.
4. Higher vs lower dividend yield
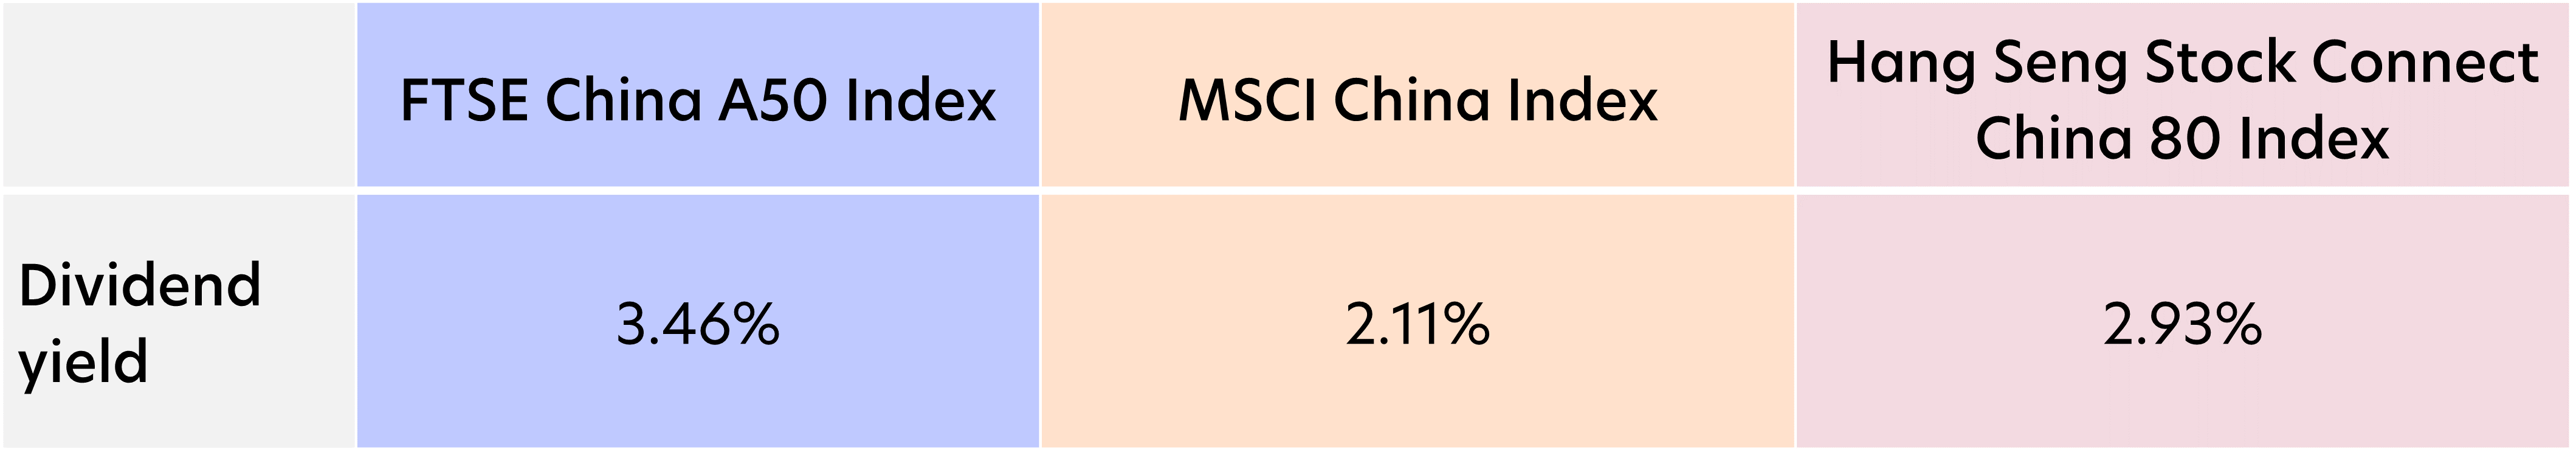
Source: FTSE Russell, MSCI, Hang Seng Index, as of 31 March 2025
For income seekers, the FTSE China A50 Index offers the highest dividend yield, followed by Hang Seng Stock Connect China 80 Index and thirdly, the MSCI China Index. This is attributable to the high proportion of financial and consumer staples stocks within the FTSE China A50 Index, which generally pay attractive dividends.
It is notable that the top 10 companies in the FTSE China A50 Index have an average US revenue exposure of only 1.5 percent. In fact, six of them have zero US exposure. Of the remaining four companies, CATL has the highest exposure to the US market, which accounted for 9.7 percent of its revenue in 2024. Meanwhile, China Merchants Bank has the lowest exposure at around 0.8 percent.
This means the impact of US tariffs on company earnings and dividends should be negligible. Of course, should the global economy weaken due to US universal tariffs, the overall demand for Chinese products could decline, impacting company earnings and therefore their ability to pay dividends. However, Chinese government support should help mitigate some of these effects, and in this context, the FTSE China A50 Index dividends should be more resilient than the other indices.
Which to choose?
- For investors with an aggressive risk appetite, the Hang Seng Stock Connect China 80 Index offers good exposure to megacap China tech stocks.
- For investors seeking to invest in a wide array of sectors and stocks ranging from mid-cap to mega-cap, and both onshore and offshore-listed securities, the MSCI China Index may be well-suited.
- Finally, investors seeking a lower-volatility exposure to the China market and healthy dividend payments may prefer the FTSE China A50 Index. The high exposure to large cap domestic companies may also offer some insulation amid the intensifying US-China trade war.
Of course, investors do not have to choose just one index. It is possible to create a diversified China portfolio that encompasses two or more indices. These can be rebalanced at regular intervals to reflect the local and global market outlook.
| If you are interested in investment opportunities related to the theme covered in this article, here is a UOB Asset Management Fund to consider: You may wish to seek advice from a financial adviser before making a commitment to invest in the above fund, and in the event that you choose not to do so, you should consider carefully whether the fund is suitable for you. |
All information in this publication is based upon certain assumptions and analysis of information available as at the date of the publication and reflects prevailing conditions and UOB Asset Management Ltd (“UOBAM”)'s views as of such date, all of which are subject to change at any time without notice. Although care has been taken to ensure the accuracy of information contained in this publication, UOBAM makes no representation or warranty of any kind, express, implied or statutory, and shall not be responsible or liable for the accuracy or completeness of the information.
Potential investors should read the prospectus of the fund(s) (the “Fund(s)”) which is available and may be obtained from UOBAM or any of its appointed distributors, before deciding whether to subscribe for or purchase units in the Fund(s). Returns on the units are not guaranteed. The value of the units and the income from them, if any, may fall as well as rise. Please note that the graphs, charts, formulae or other devices set out or referred to in this document cannot, in and of itself, be used to determine and will not assist any person in deciding which investment product to buy or sell, or when to buy or sell an investment product. An investment in the Fund(s) is subject to investment risks and foreign exchange risks, including the possible loss of the principal amount invested. Investors should consider carefully the risks of investing in the Fund(s) and may wish to seek advice from a financial adviser before making a commitment to invest in the Fund(s). Should you choose not to seek advice from a financial adviser, you should consider carefully whether the Fund(s) is suitable for you. Investors should note that the past performance of any investment product, manager, company, entity or UOBAM mentioned in this publication, and any prediction, projection or forecast on the economy, stock market, bond market or the economic trends of the markets is not necessarily indicative of the future or likely performance of any investment product, manager, company, entity or UOBAM or the economy, stock market, bond market or economic trends of the markets. Nothing in this publication shall constitute a continuing representation or give rise to any implication that there has not been or that there will not be any change affecting the Funds. All subscription for the units in the Fund(s) must be made on the application forms accompanying the prospectus of that fund.
The above information is strictly for general information only and is not an offer, solicitation advice or recommendation to buy or sell any investment product or invest in any company. This publication should not be construed as accounting, legal, regulatory, tax, financial or other advice. Investments in unit trusts are not obligations of, deposits in, or guaranteed or insured by United Overseas Bank Limited, UOBAM, or any of their subsidiary, associate or affiliate or their distributors. The Fund(s) may use or invest in financial derivative instruments, and you should be aware of the risks associated with investments in financial derivative instruments which are described in the Fund(s)’ prospectus.
This advertisement has not been reviewed by the Monetary Authority of Singapore.
UOB Asset Management Ltd Co. Reg. No. 198600120Z