UOB bank


MARKET DEVELOPMENTS
Asset class performance (% in SGD terms)
Source: FactSet/Bloomberg. Performance as at 31 December 2025.
Indices used as follows:
Global Equities: MSCI All Country World Index (ACWI);
Global Bonds: Bloomberg Global Aggregate Index;
Asian Equities: MSCI AC Asia ex Japan Index; and
Asian Bonds: J.P.Morgan Asia Credit (JACI) Investment Grade Index on a Net Asset Value basis;
SGD Cash: 3M Singapore Overnight Rate Average (SORA)
Please note that there are limitations to the use of such indices as proxies for the past performance in the respective asset classes. The historical performance presented should not be used as a proxy for the future or likely performance.
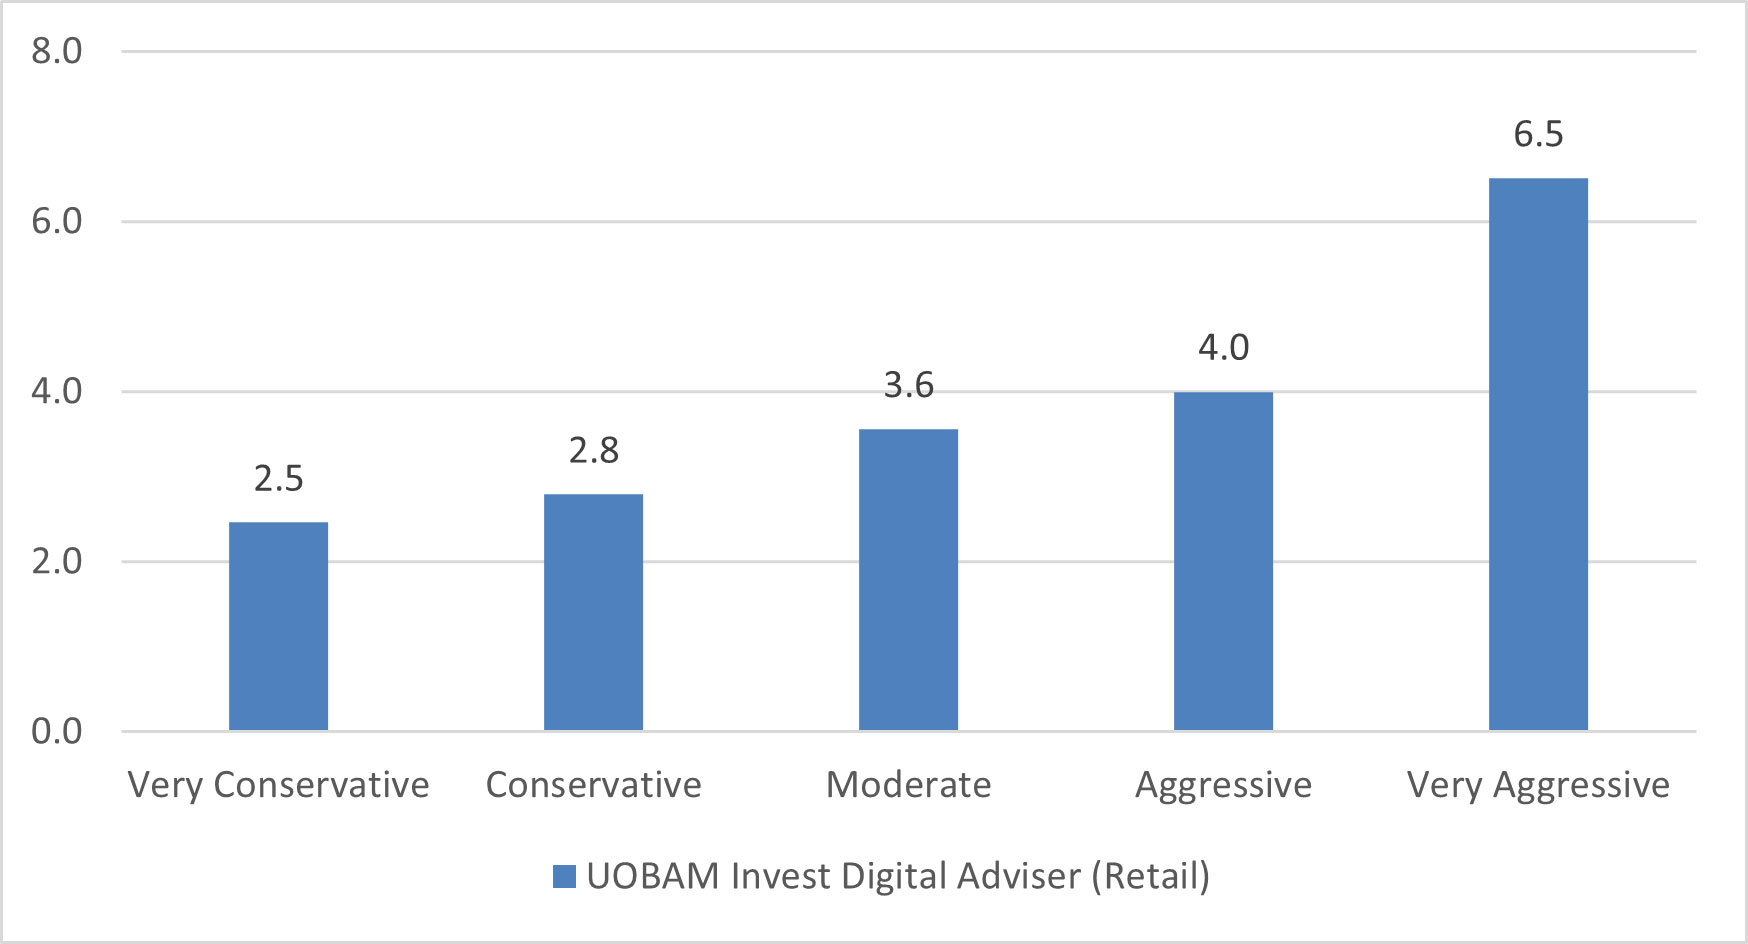
Portfolio returns (% in SGD terms) 30 September 2025 – 31 December 2025
Source: Factset / UOBAM. Portfolio returns are for the period from 30 September 2025 to 31 December 2025.
Past performance of the portfolio or UOBAM and any past performance, prediction, projection or forecast on the economy or markets are not necessarily indicative of the future or likely performance of the portfolio or UOBAM. Portfolio returns on the scheme is calculated on a single pricing basis.
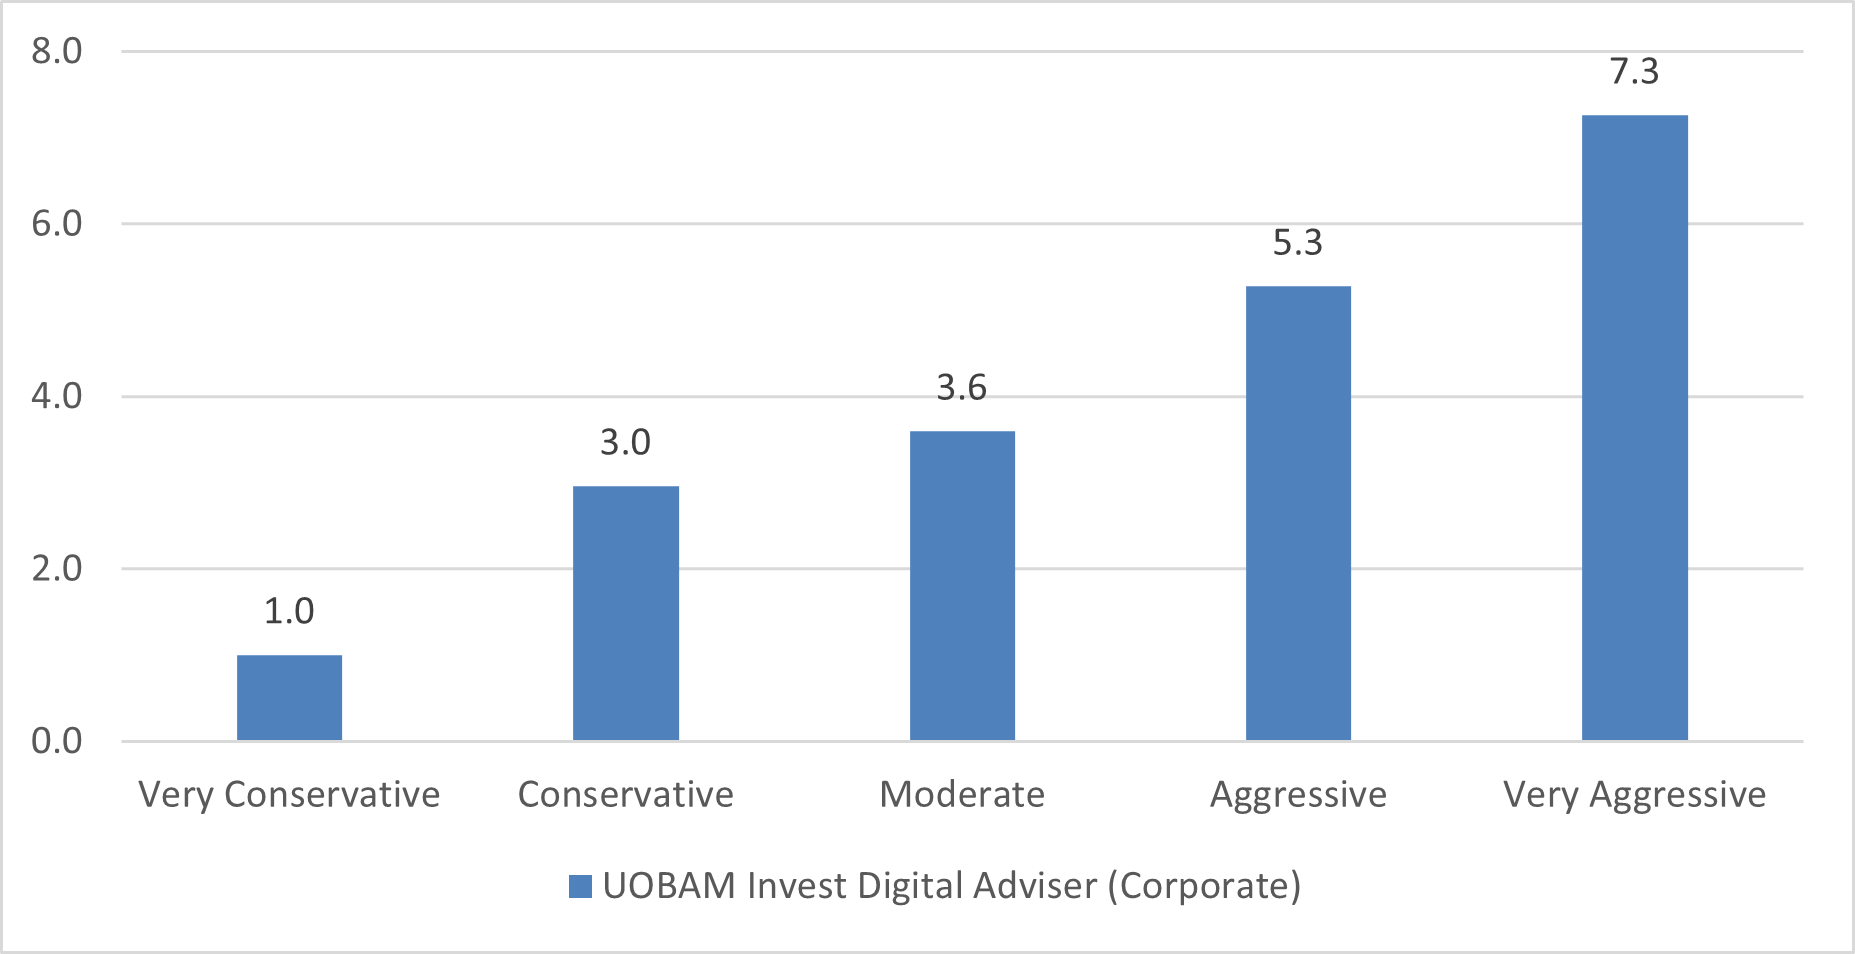
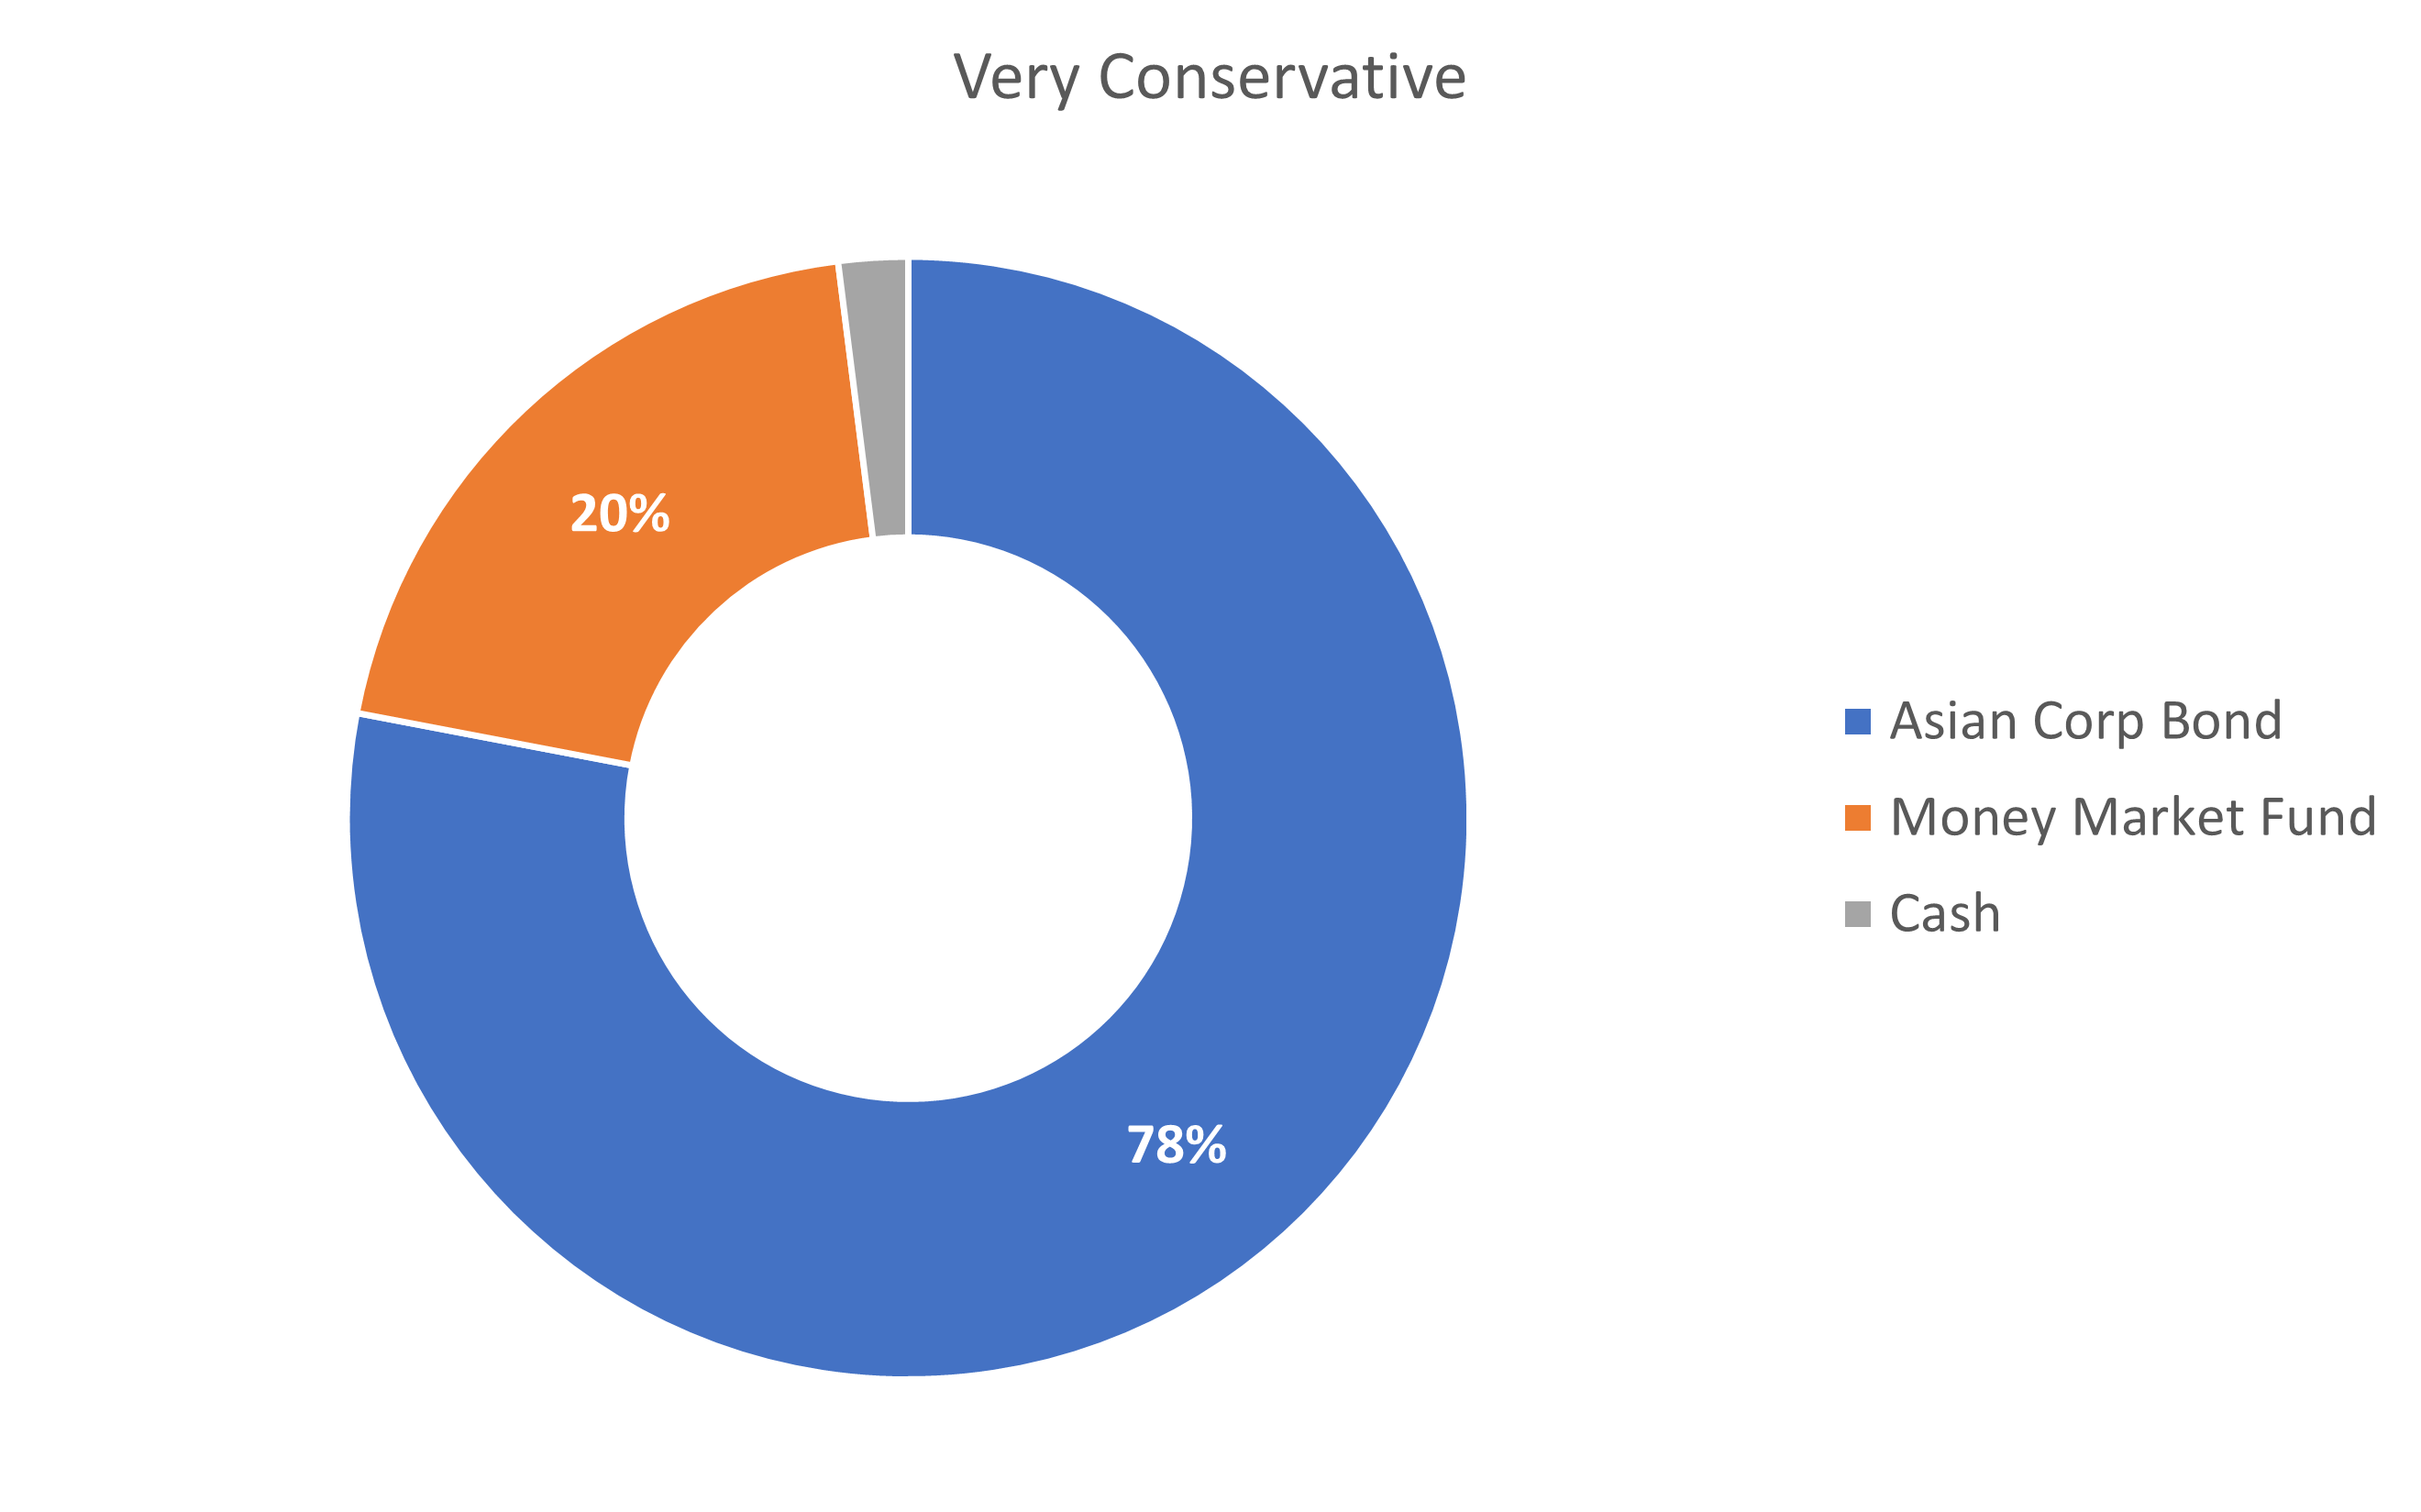
1. Very Conservative portfolio
| Period (as at 31 December 2025) | Portfolio Return (%) |
| 3 months | 0.7 |
| 6 months | 3.8 |
| 1 year | 3.5 |
| Since Inception (26 July 2020), per annum |
0.3 |
Source: UOBAM as of 31 December 2025
The information about asset allocation provided herein are subject to change at the discretion of UOBAM without prior notice. Past performance of the portfolio or UOBAM and any past performance, prediction, projection or forecast on the economy or markets are not necessarily indicative of the future or likely performance of the portfolio or UOBAM. Returns are calculated on a single pricing basis.
For the three-month period ending 31 December 2025, this portfolio was up 0.7 percent. Asia investment-grade bonds were the strongest contributor over the quarter, while the money market fund contributed the least.
Over the one-year period, the portfolio gained 3.5 percent. US equities were the main positive contributor, while US government bonds detracted from overall returns.
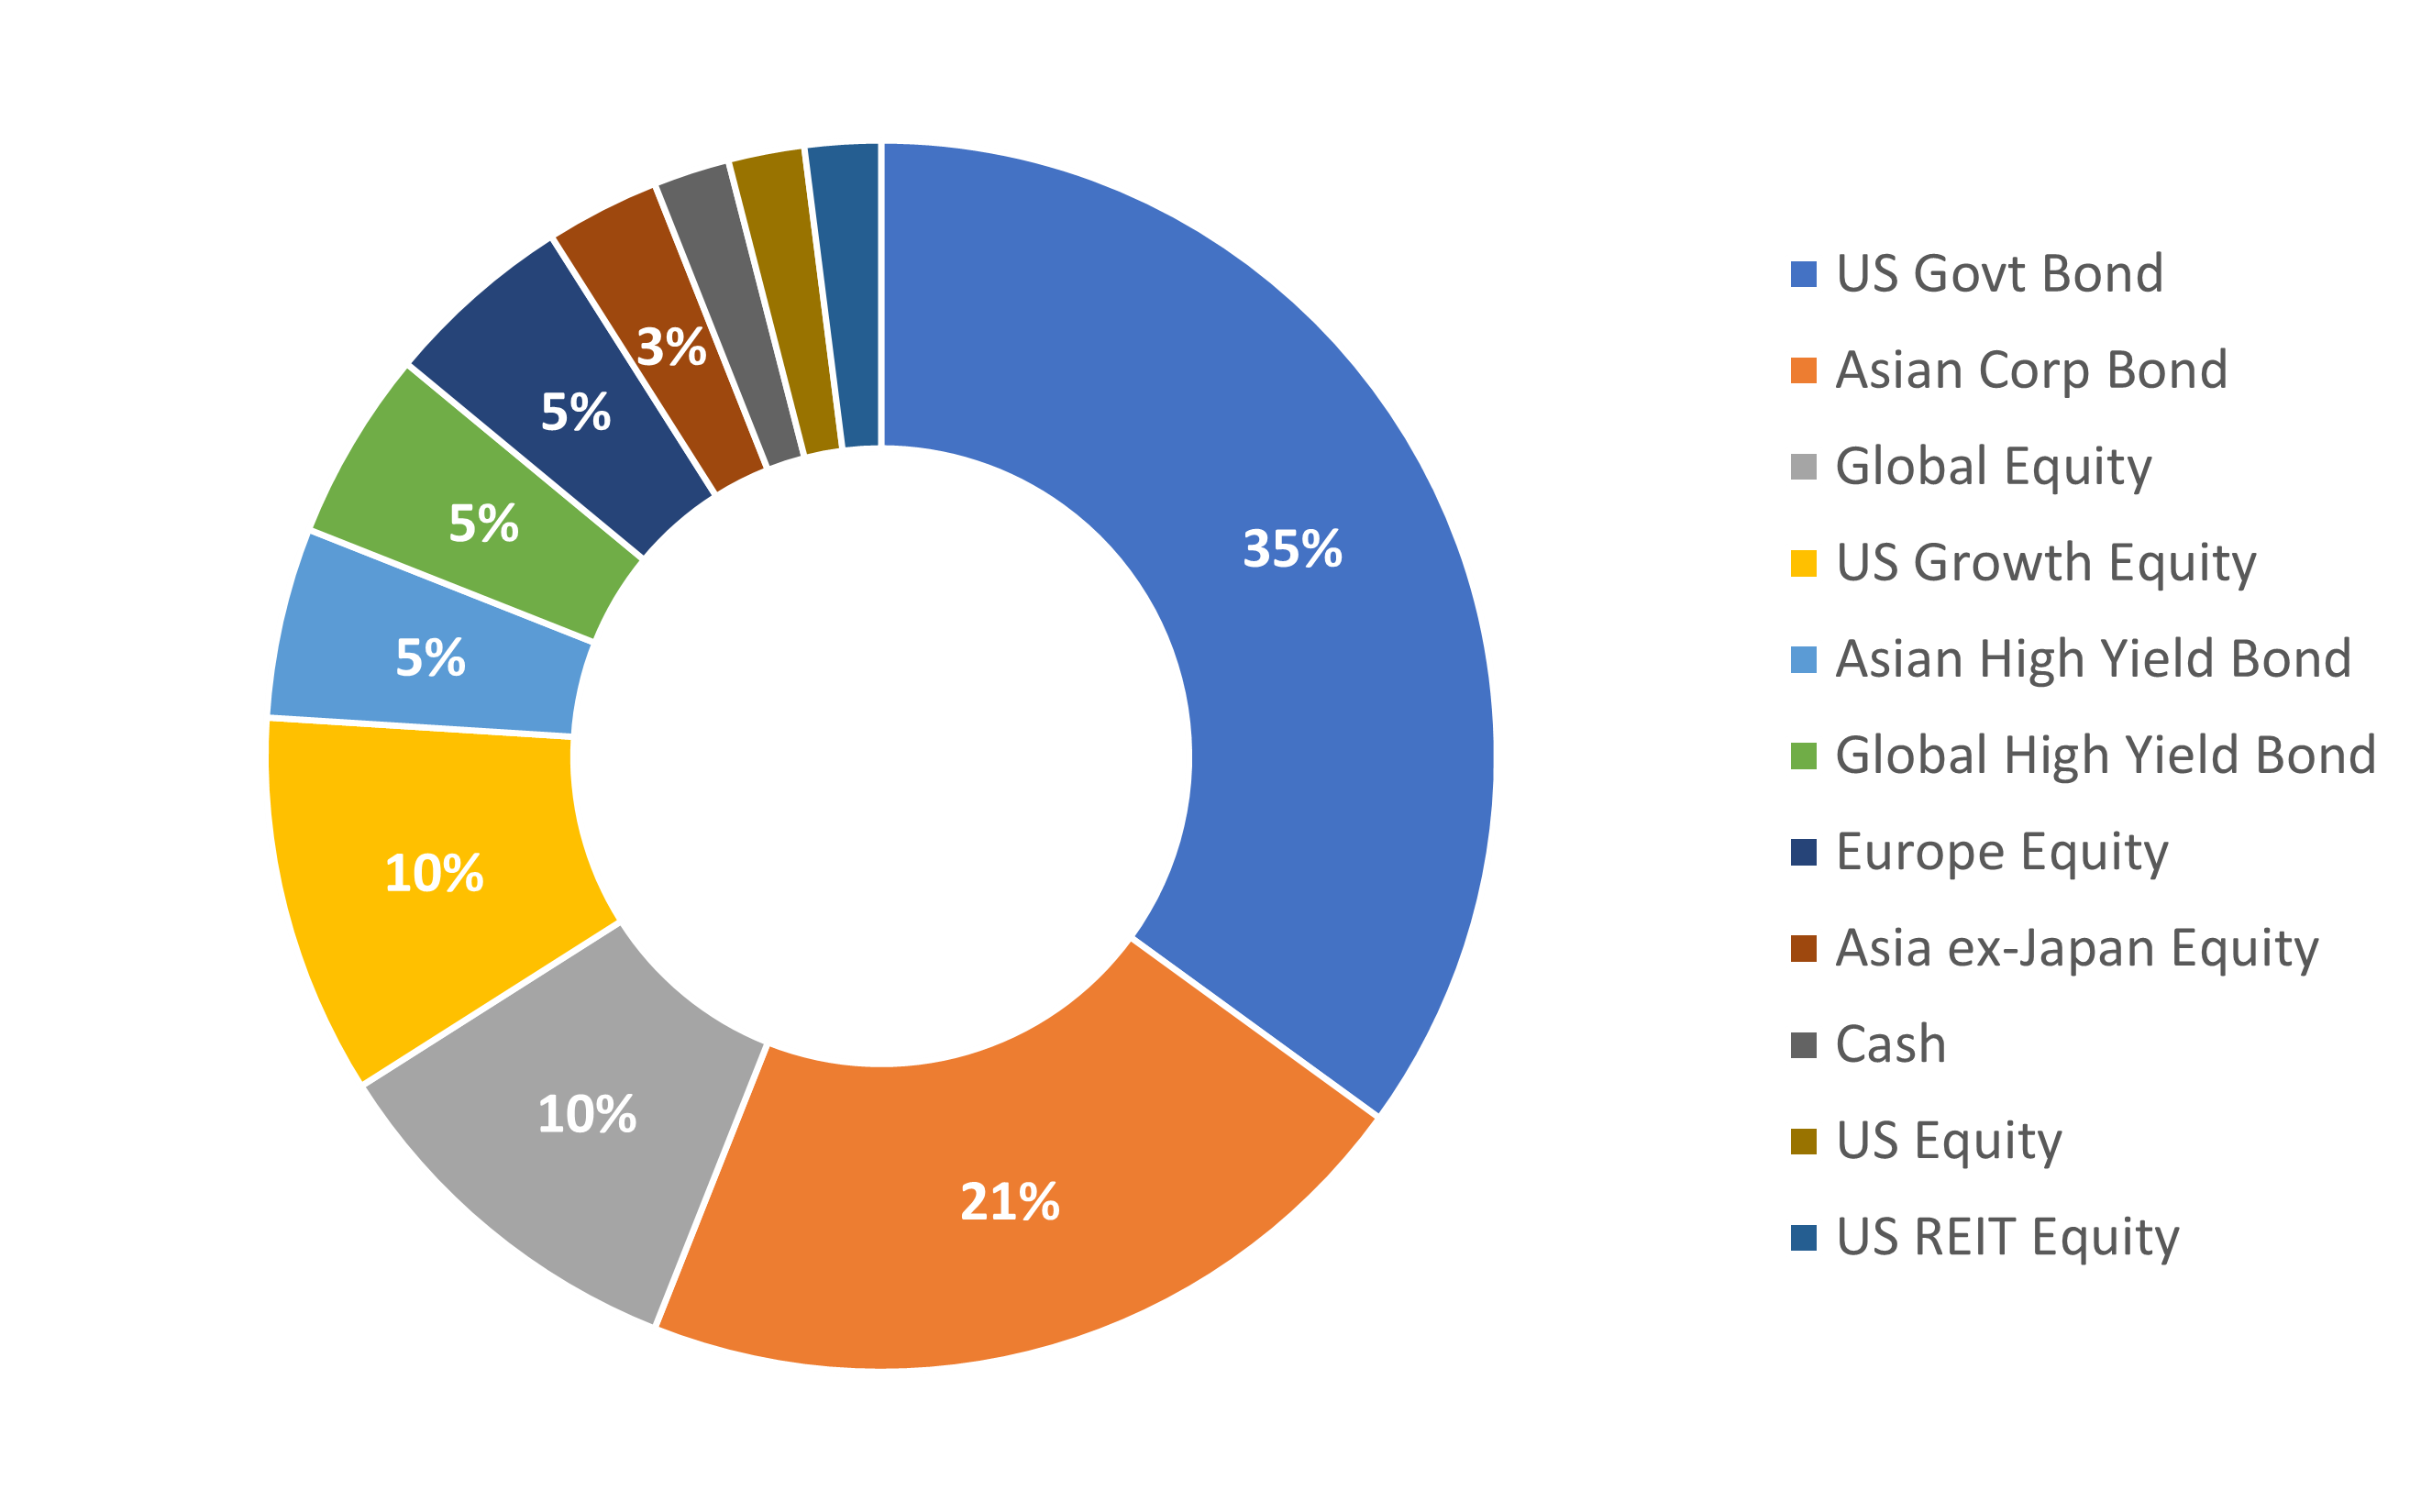
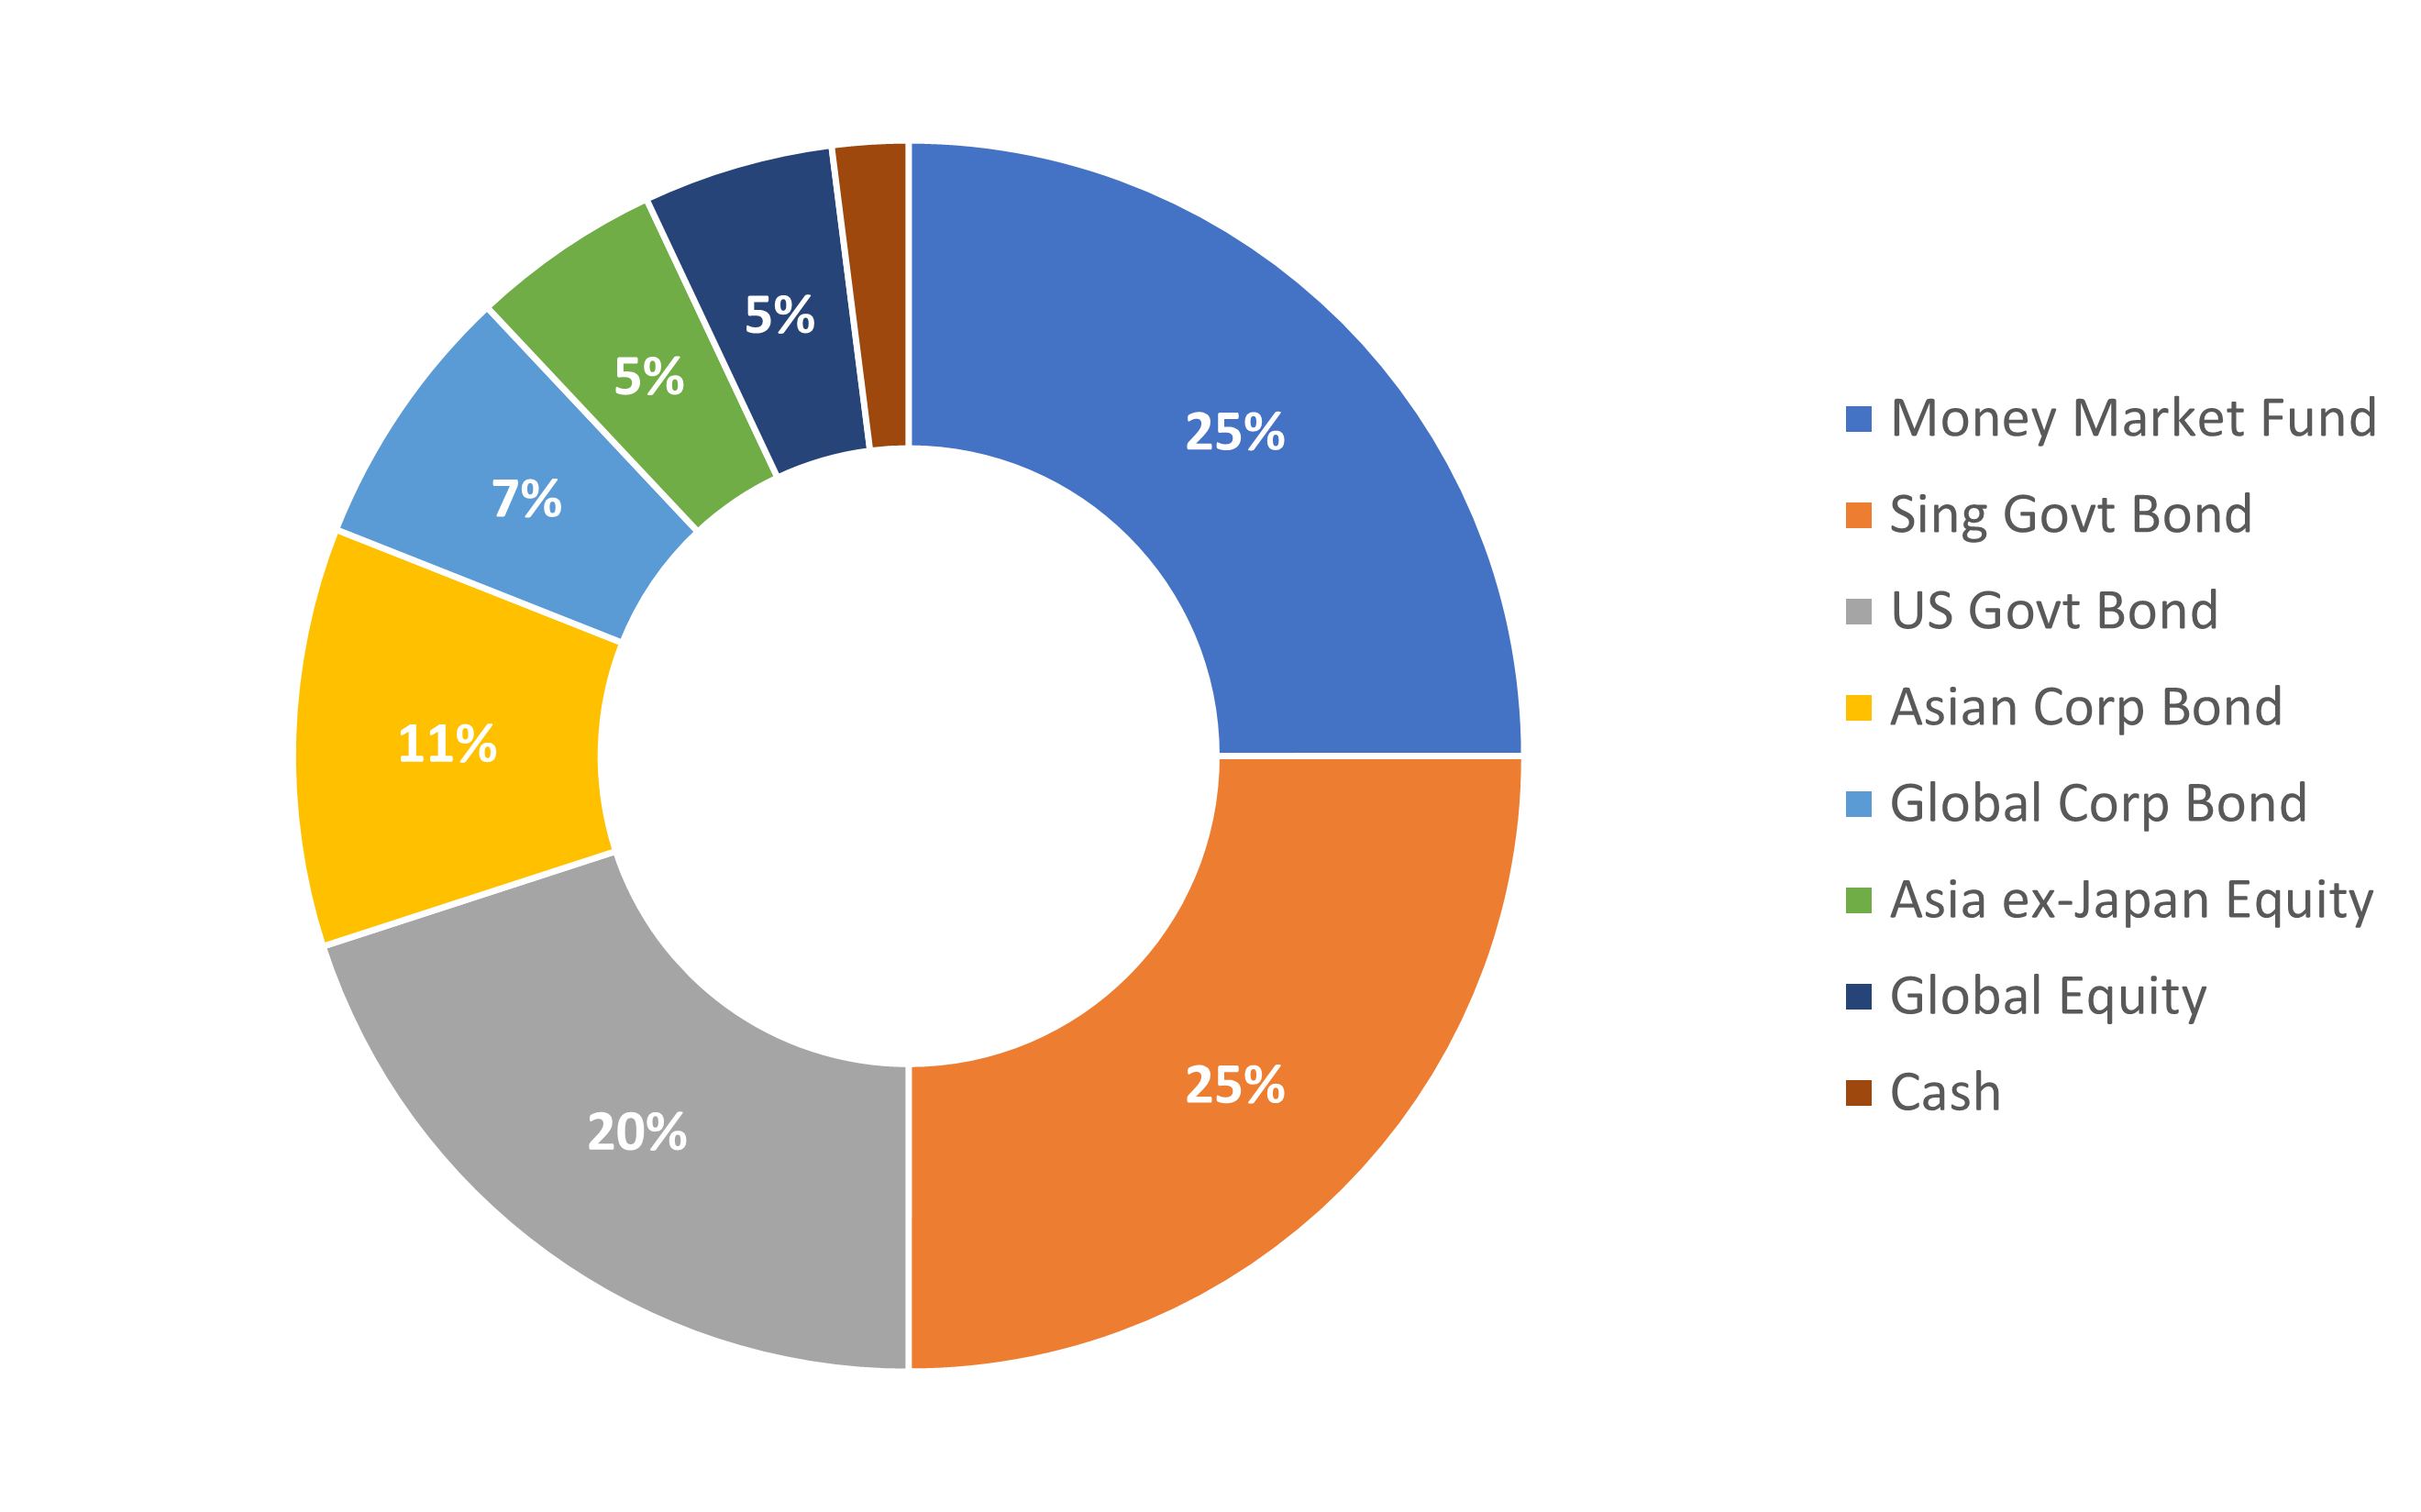
2. Conservative portfolio
| Period (as at 31 December 2025) | Portfolio Return (%) |
| 3 months | 1.0 |
| 6 months | 5.2 |
| 1 year | 4.7 |
| Since Inception (26 July 2020), per annum |
2.6 |
Source: UOBAM as of 31 December 2025
The information about asset allocation provided herein are subject to change at the discretion of UOBAM without prior notice. Past performance of the portfolio or UOBAM and any past performance, prediction, projection or forecast on the economy or markets are not necessarily indicative of the future or likely performance of the portfolio or UOBAM. Returns are calculated on a single pricing basis.
For the three-month period ending 31 December 2025, the portfolio delivered a 1.0 percent return. US equities were the strongest contributor during the quarter, while Asia equities contributed the least.
Over the one-year period, the portfolio gained 4.7 percent. US equities again represented the largest positive contributor, while US government bonds detracted from overall performance.
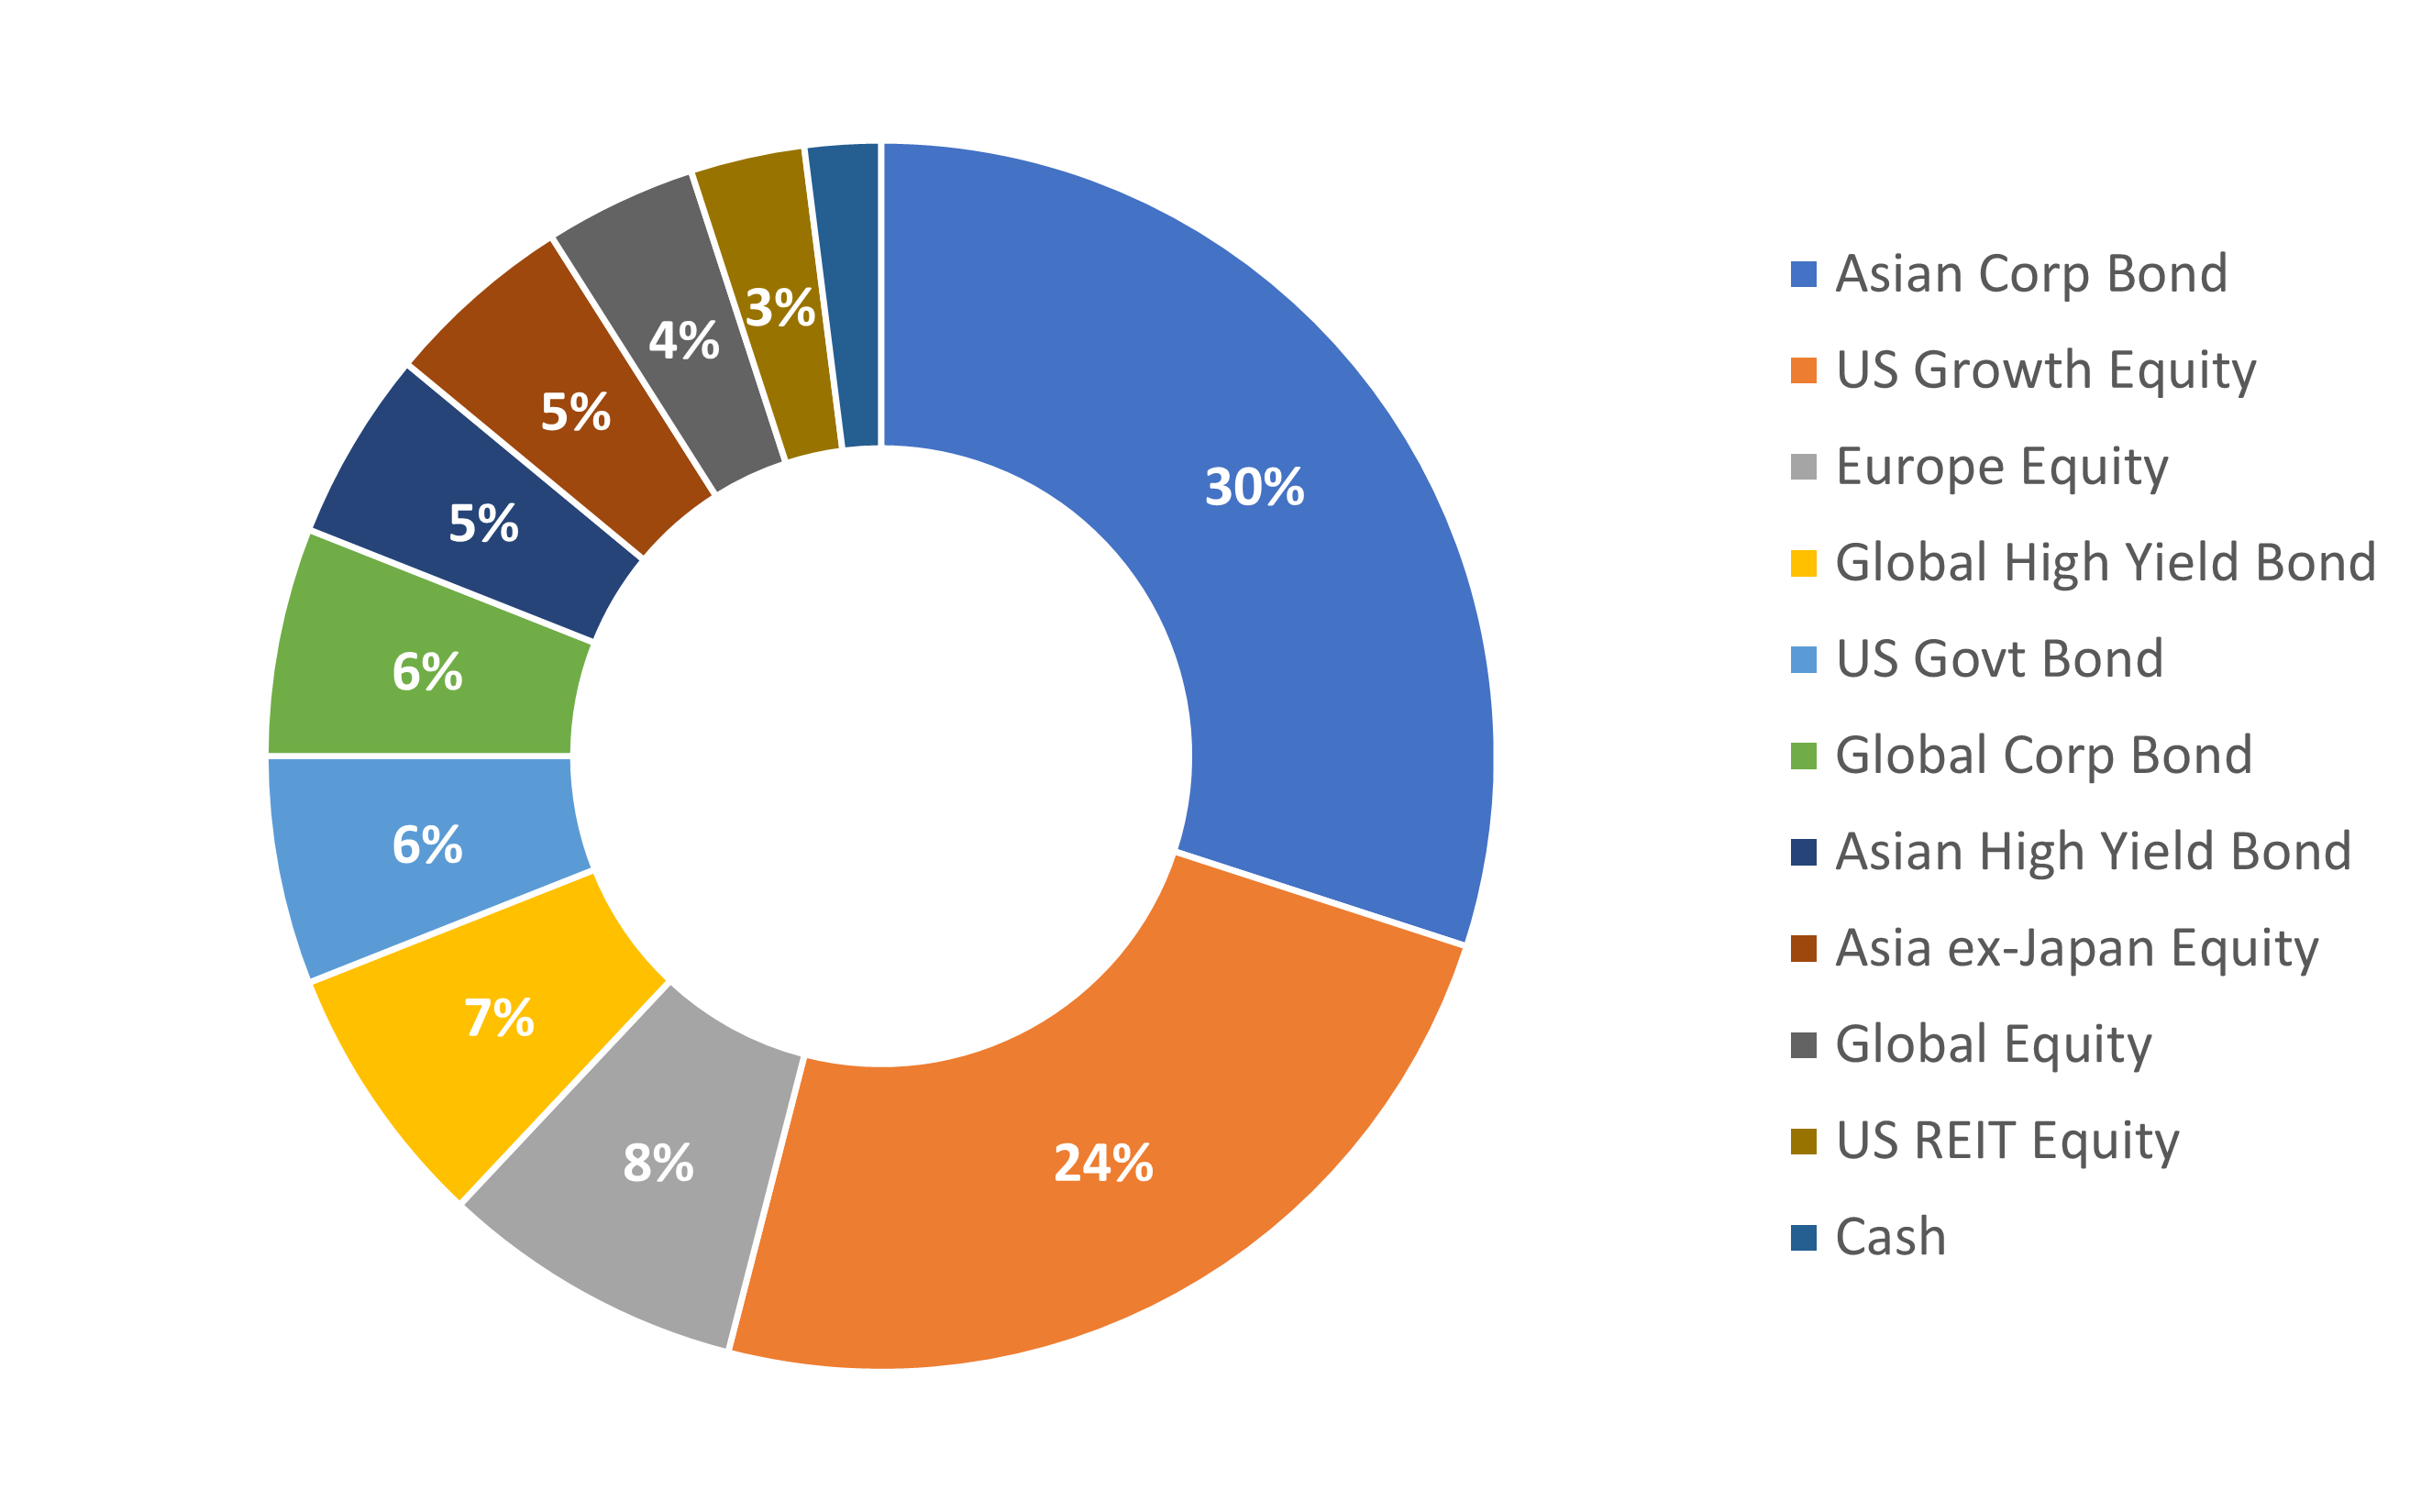
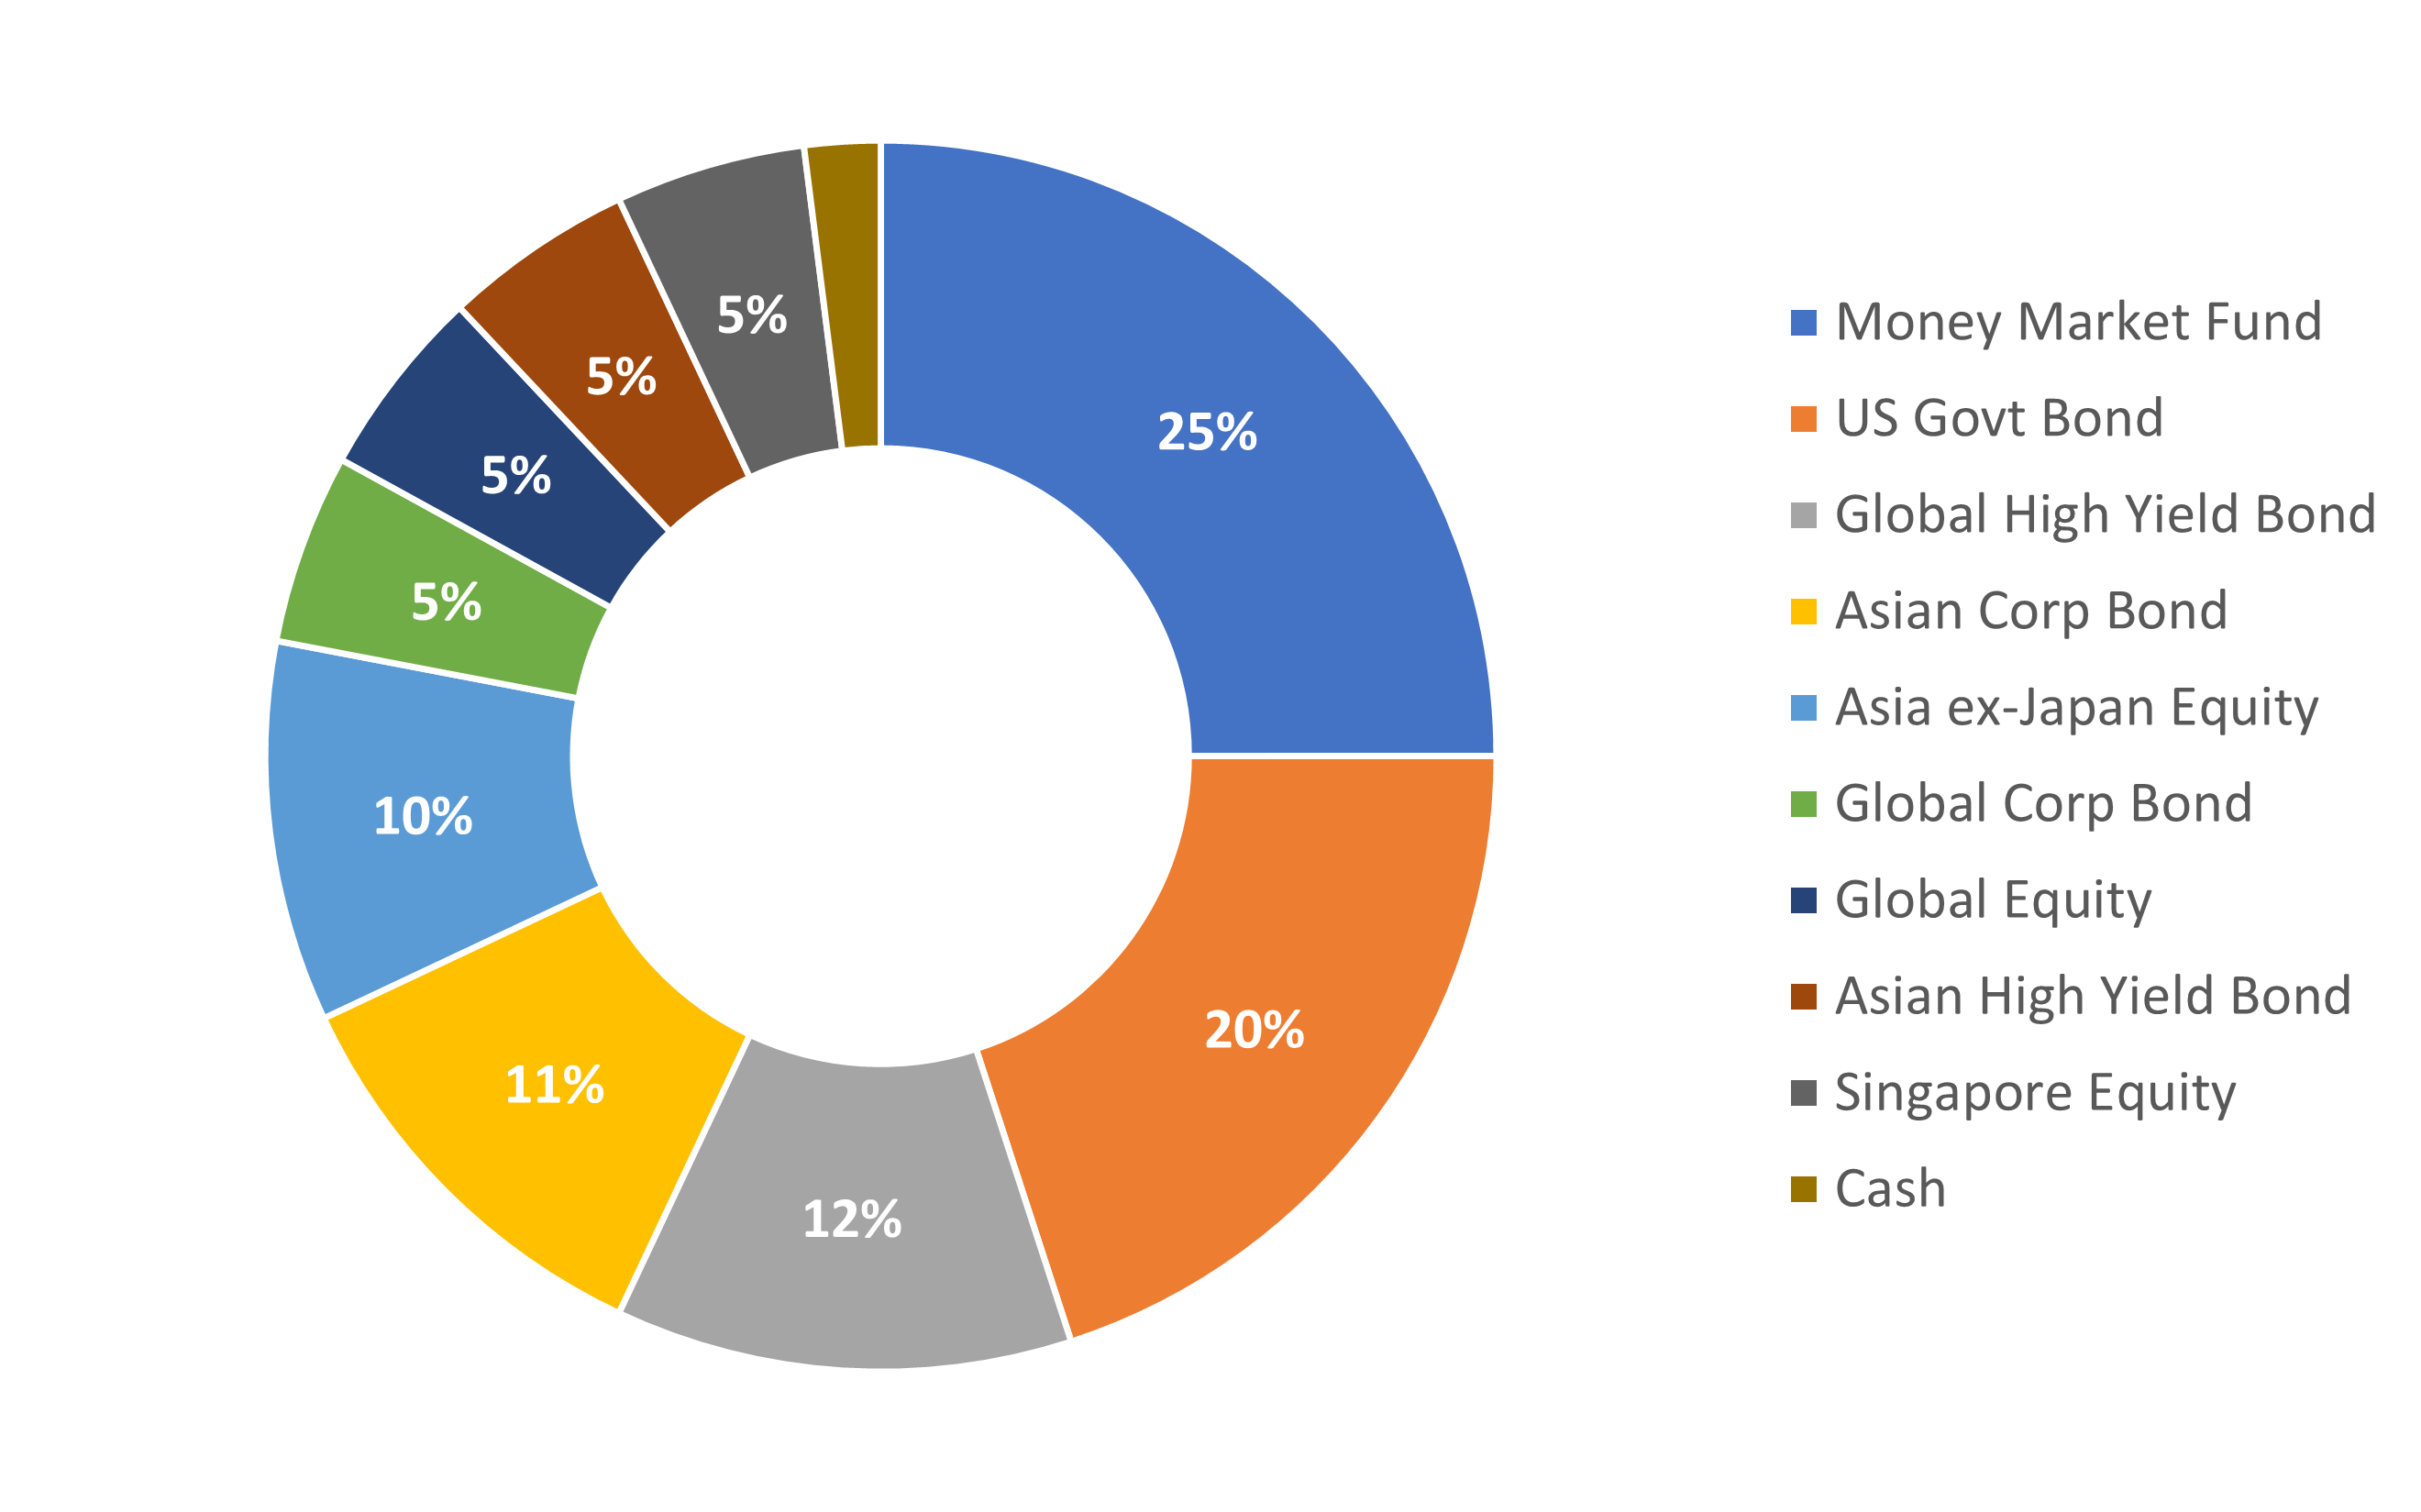
3. Moderate portfolio
| Period (as at 31 December 2025) | Portfolio Return (%) |
| 3 months | 1.3 |
| 6 months | 5.9 |
| 1 year | 6.6 |
| Since Inception (26 July 2020), per annum |
4.7 |
Source: UOBAM as of 31 December 2025
The information about asset allocation provided herein are subject to change at the discretion of UOBAM without prior notice. Past performance of the portfolio or UOBAM and any past performance, prediction, projection or forecast on the economy or markets are not necessarily indicative of the future or likely performance of the portfolio or UOBAM. Returns are calculated on a single pricing basis.
For the three-month period ending 31 December 2025, the portfolio returned 1.3 percent. US equities were the strongest contributor over the quarter, while Asia high-yield bonds contributed the least.
Over the one-year period, the portfolio gained 6.6 percent. US growth equities were the largest positive contributor, while global equities detracted the most from overall returns.
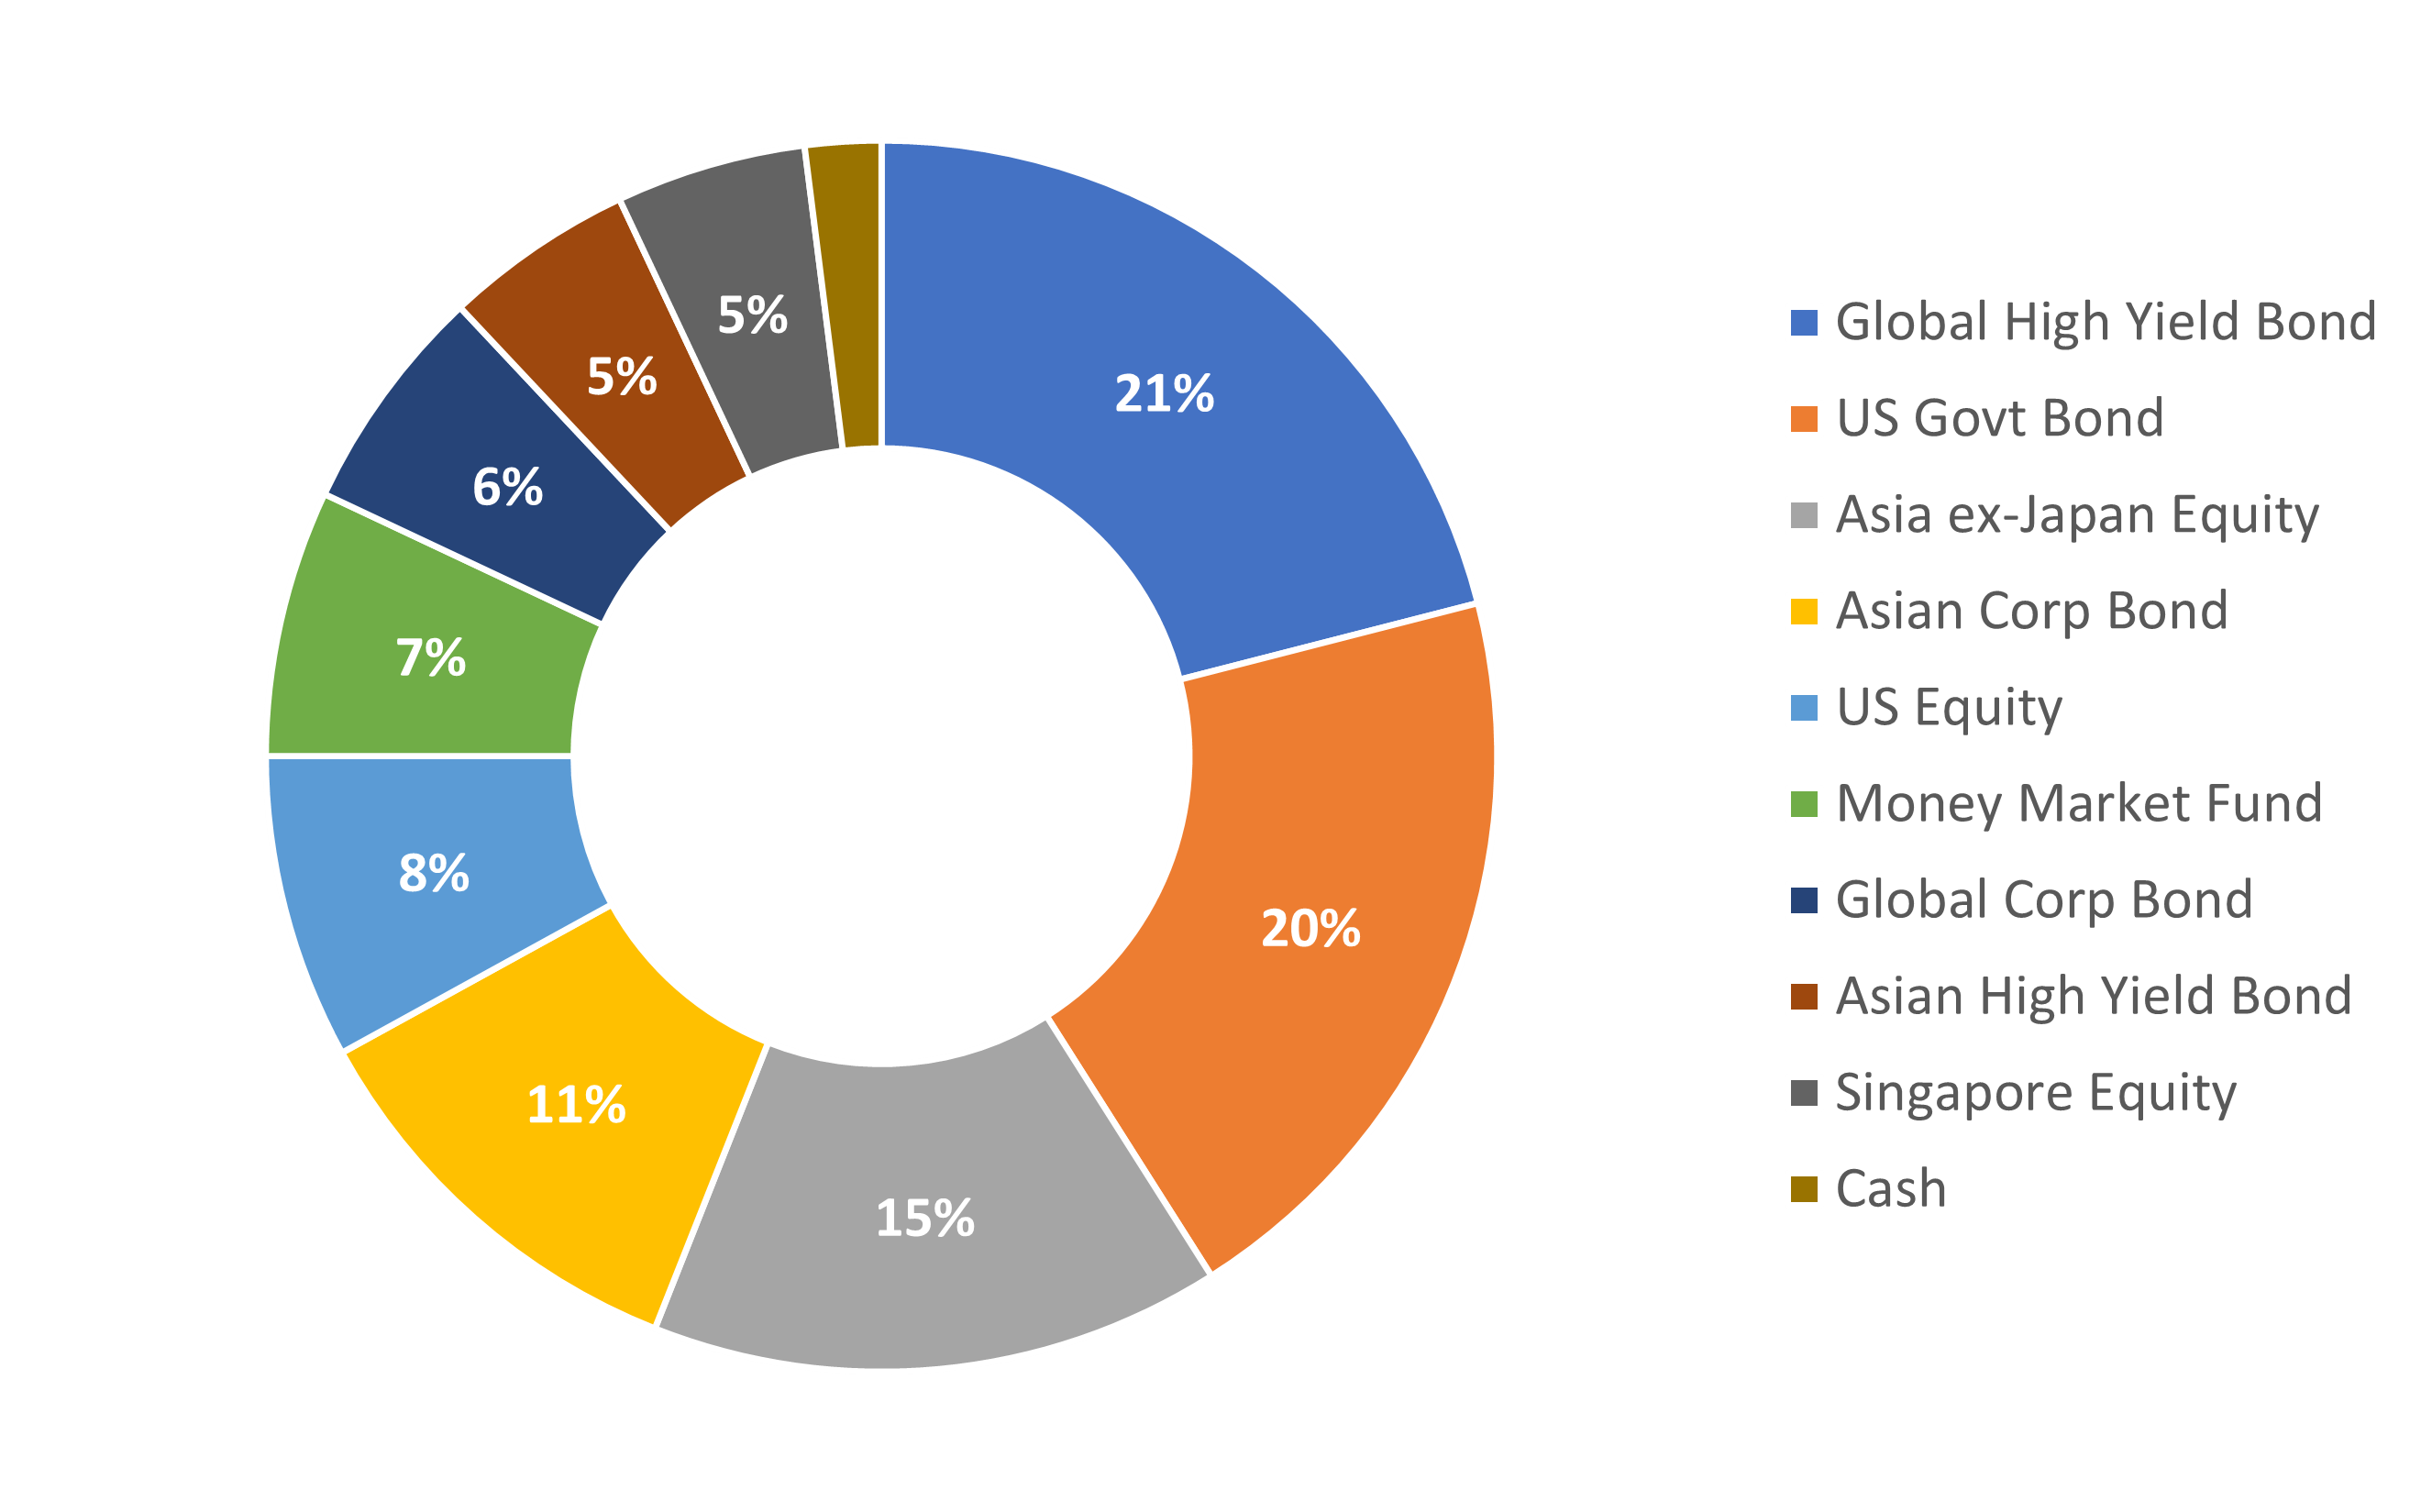
4. Aggressive portfolio
| Period (as at 31 December 2025) | Portfolio Return (%) |
| 3 months | 1.7 |
| 6 months | 7.0 |
| 1 year | 9.3 |
| Since Inception (26 July 2020), per annum |
7.5 |
Source: UOBAM as of 31 December 2025
The information about asset allocation provided herein are subject to change at the discretion of UOBAM without prior notice. Past performance of the portfolio or UOBAM and any past performance, prediction, projection or forecast on the economy or markets are not necessarily indicative of the future or likely performance of the portfolio or UOBAM. Returns are calculated on a single pricing basis.
For the three-month period ending 31 December 2025, the portfolio gained 1.7 percent. US growth equities were the strongest contributor over the quarter, while Asia high-yield bonds contributed the least.
Over the one-year period, the portfolio returned 9.3 percent. US growth equities were the largest positive contributor, while US REITs detracted the most from overall returns.
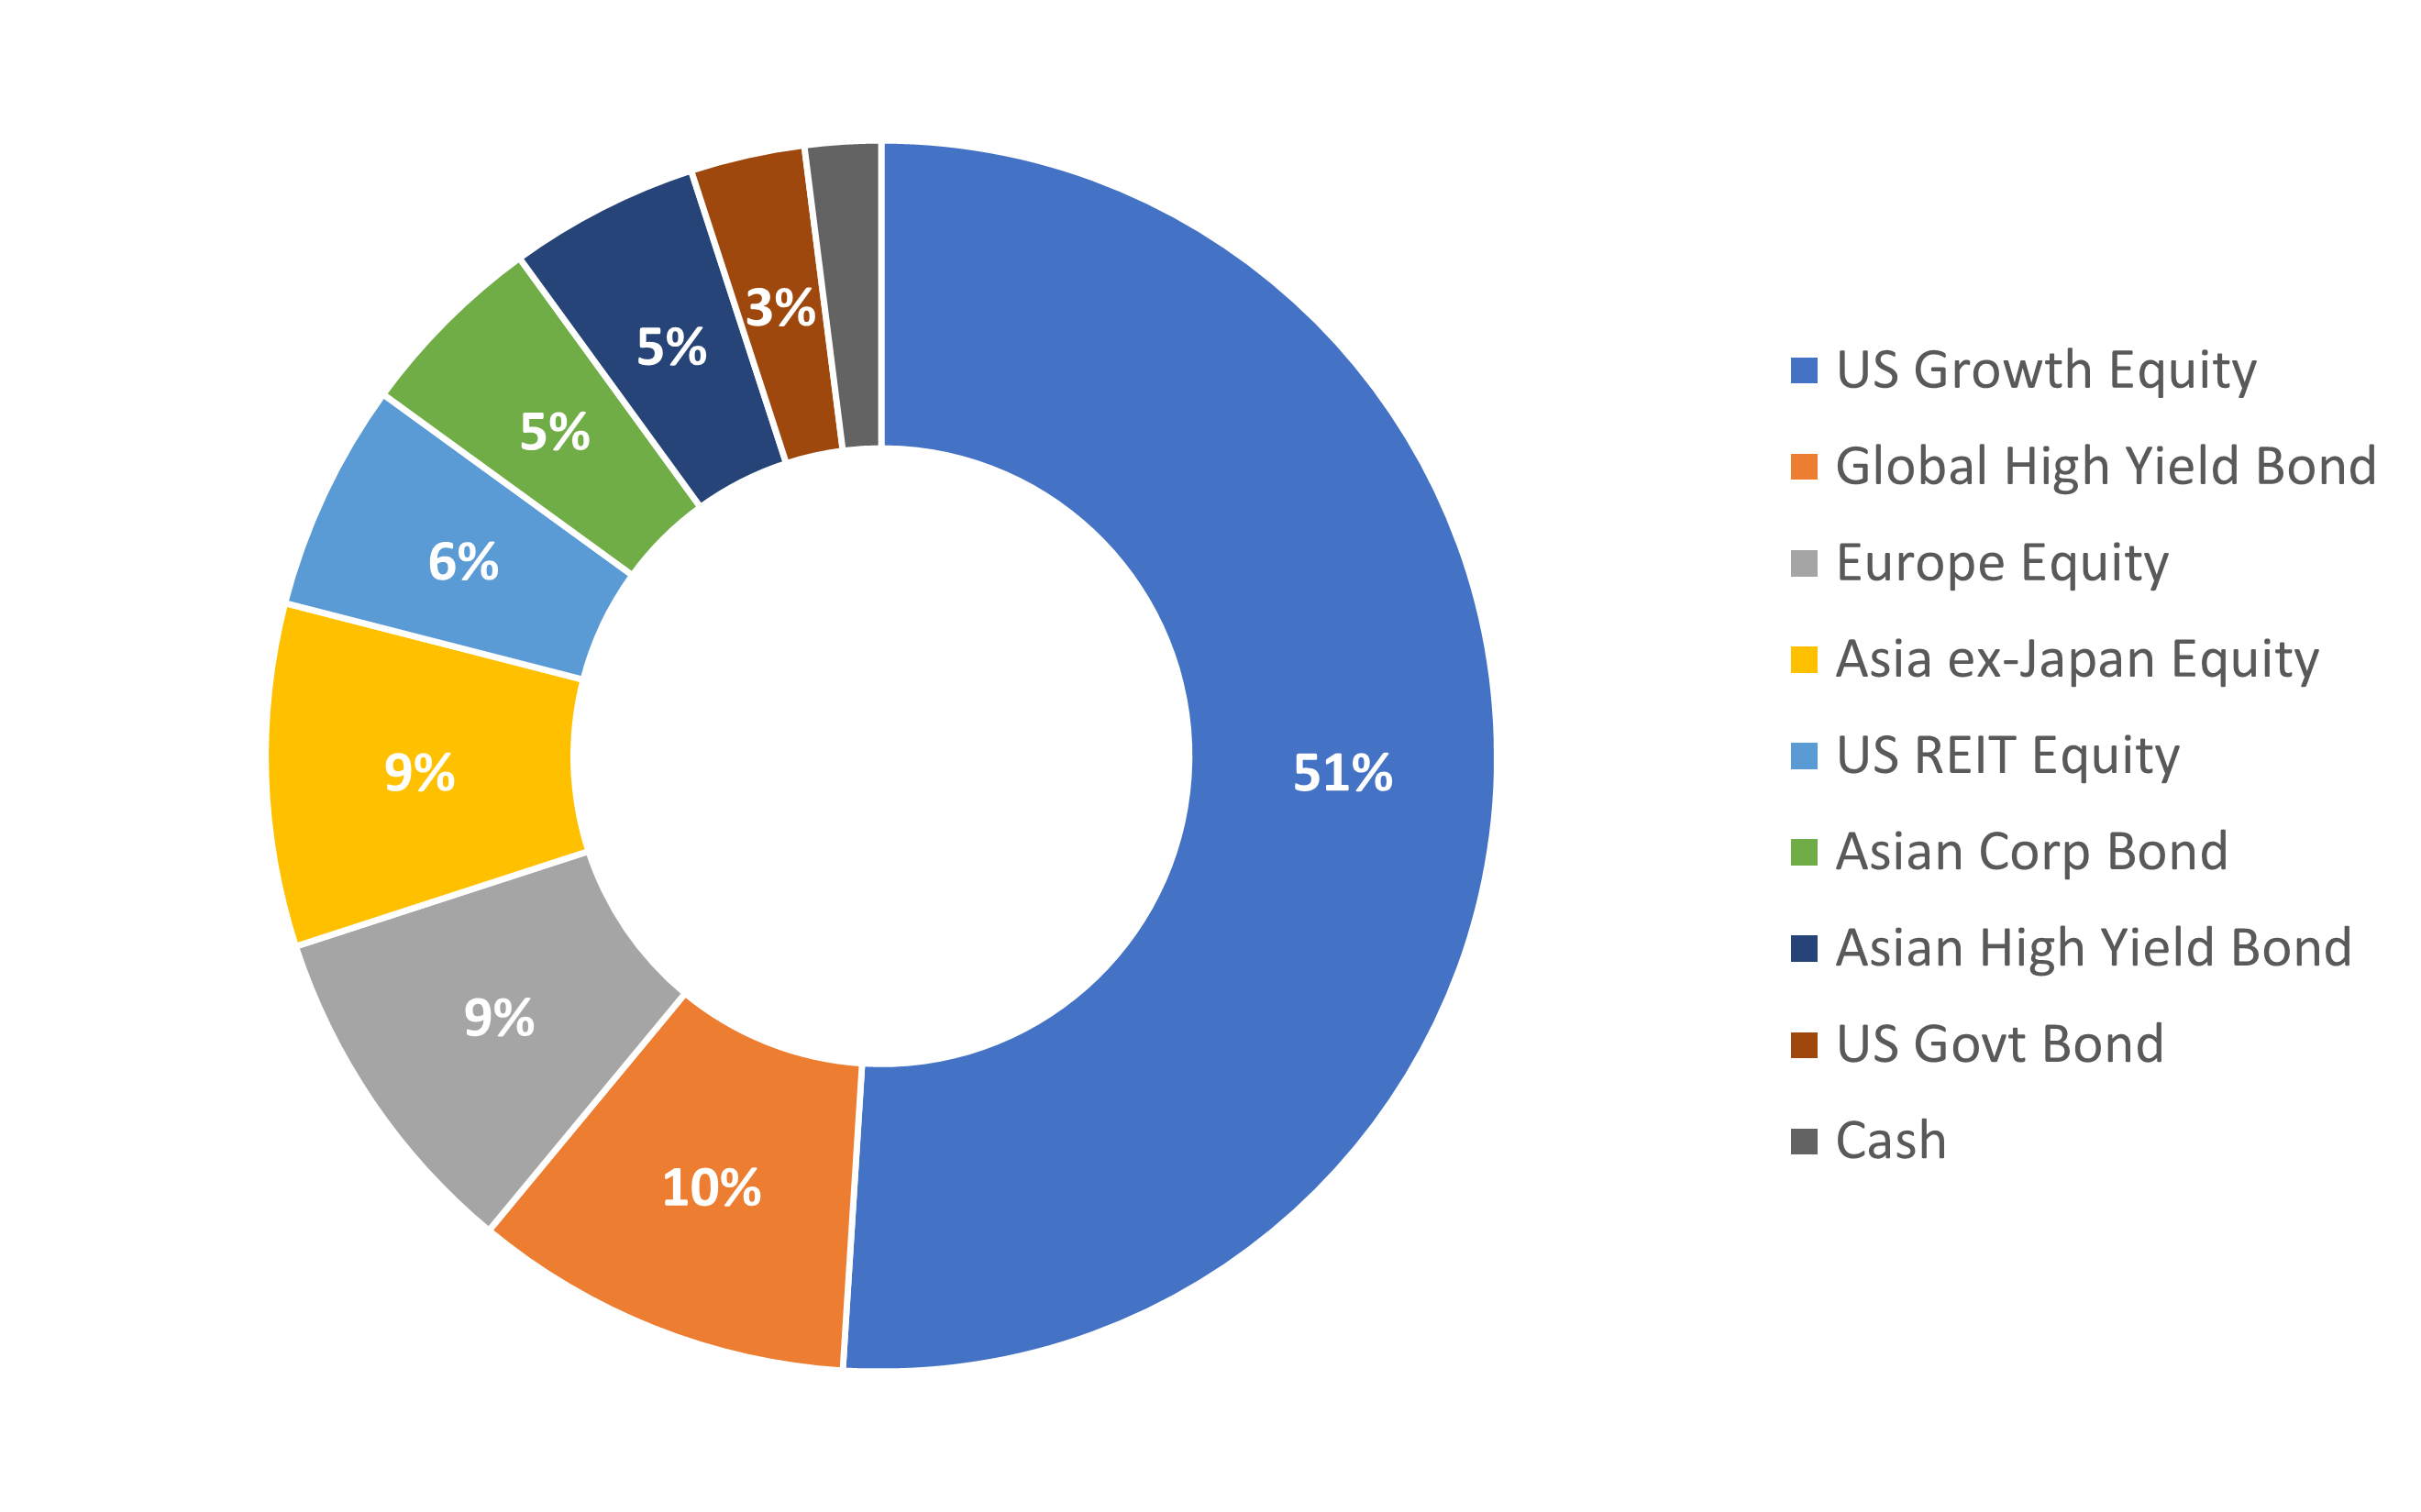
5. Very Aggressive portfolio
| Period (as at 31 December 2025) | Portfolio Return (%) |
| 3 months | 2.4 |
| 6 months | 10.5 |
| 1 year | 12.4 |
| Since Inception (26 July 2020), per annum |
10.0 |
Source: UOBAM as of 31 December 2025
The information about asset allocation provided herein are subject to change at the discretion of UOBAM without prior notice. Past performance of the portfolio or UOBAM and any past performance, prediction, projection or forecast on the economy or markets are not necessarily indicative of the future or likely performance of the portfolio or UOBAM. Returns are calculated on a single pricing basis.
For the three-month period ending 31 December 2025, the portfolio returned 2.4 percent. US growth equities were the strongest contributor over the quarter, while Asian investment-grade bonds added the least to performance.
Over the one-year period, the portfolio gained 12.4 percent. US growth equities were the primary driver of returns, while US REITs detracted the most from overall returns.
As we move into 2026, economic conditions are becoming more supportive. Fiscal and monetary policy are expected to turn more accommodative, with new tax incentives and further rate cuts following those implemented at the end of 2025. The drag from tariffs on global growth is likely to fade by mid-year, while corporate fundamentals remain strong. Consensus forecasts for 2026 earnings growth stand at 13 percent for the US, 11 percent for Europe, 10 percent for Japan, and 18 percent for Asia ex-Japan, reinforcing a constructive outlook for global markets.
Strong corporate profit growth and improving productivity underpin expectations for continued market resilience. Historically, double-digit earnings growth tends to align with strong equity performance, and companies today are generally maintaining margins with lower leverage compared to previous high-valuation periods. These dynamics suggest the current expansion cycle could extend for another one to two years, supported by ongoing investment in technology and AI.
Across Asia, a growing middle class, attractive valuations, and currency strength remain key pillars of support. In China, liquidity conditions, anti-involution measures, and more measured consumer policies are expected to sustain market performance, with the extension of the US tariff pause to November 2026 providing additional relief. India may encounter headwinds as US tariffs weigh on near-term growth, while valuations in Taiwan and Korea appear stretched after strong tech-sector performance, prompting a more cautious stance.
Global bond markets are expected to remain stable, with US 10-year Treasury yields projected to trade between 4.0 percent and 4.5 percent in Q1 2026. The Fed funds rate is expected to decline toward 3.25 percent by mid-year, supporting a neutral stance on duration. We favour investment-grade developed market credit as developed market economies continue to demonstrate resilience. However, heightened policy uncertainty in the US and ongoing geopolitical risks warrant a prudent approach. While high-yield names may offer wider spreads, they are more exposed to macro shocks and external funding pressures, whereas investment-grade bonds are better positioned to weather volatility.
With economic risks fading and corporate earnings remaining healthy, we expect the market expansion cycle to continue and are shifting to a modest equity overweight. Within equities, we maintain an overweight in Asia and are upgrading our outlook on the US market to positive, supported by improving profit margins from technological innovation and productivity gains. We continue to monitor inflation dynamics, labour-market trends, and tariff developments closely, standing ready to adjust our positioning as conditions evolve.
1 July 2025 to 30 September 2025
1 January 2025 to 31 March 2025
1 October 2024 to 31 December 2024
30 June 2024 to 30 September 2024
1 January 2024 to 31 March 2024
1 October 2023 to 31 December 2023
1 July 2023 to 30 September 2023
1 January 2023 to 31 March 2023
1 October 2022 to 31 December 2022
1 January 2022 to 31 March 2022
1 July 2021 to 31 December 2021
MARKET DEVELOPMENTS
Asset class performance (% in SGD terms)
Source: FactSet/Bloomberg. Performance as at 31 December 2025.
Indices used as follows:
Global Equities: MSCI All Country World Index (ACWI);
Global Bonds: Bloomberg Global Aggregate Index;
Asian Equities: MSCI AC Asia ex Japan Index; and
Asian Bonds: J.P.Morgan Asia Credit (JACI) Investment Grade Index on a Net Asset Value basis;
SGD Cash: 3M Singapore Overnight Rate Average (SORA)
Please note that there are limitations to the use of such indices as proxies for the past performance in the respective asset classes. The historical performance presented should not be used as a proxy for the future or likely performance.
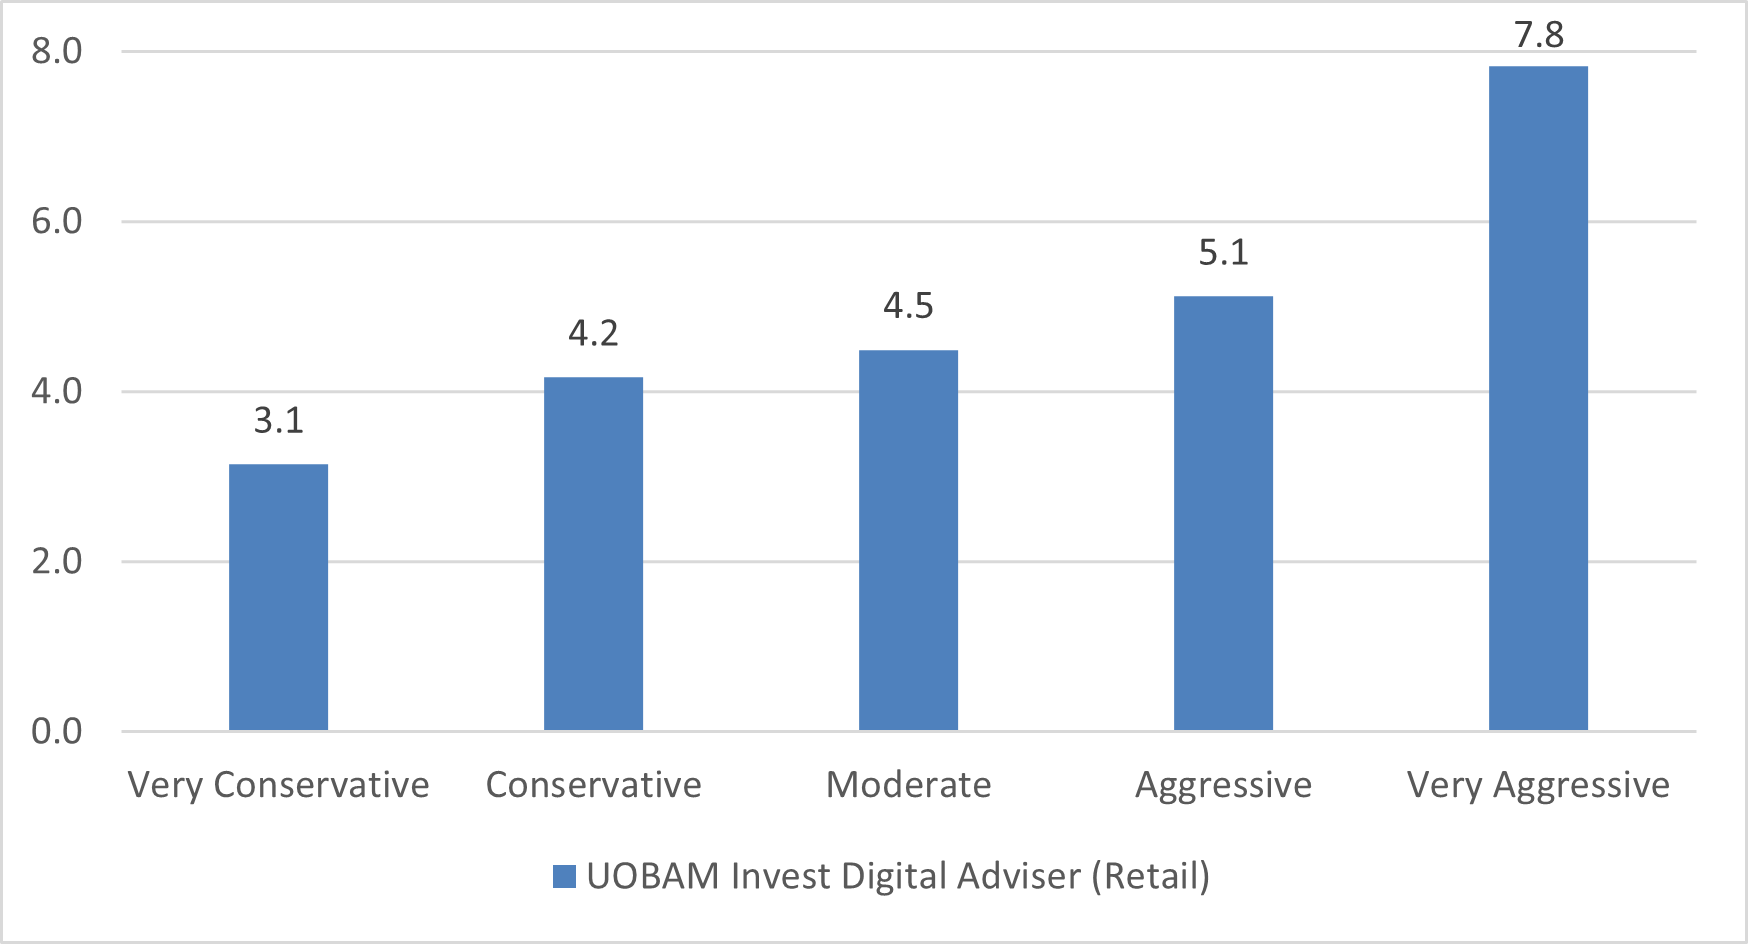
Portfolio returns (% in SGD terms) 30 September 2025 – 31 December 2025
Source: Factset / UOBAM. Portfolio returns are for the period from 30 September 2025 to 31 December 2025.
Past performance of the portfolio or UOBAM and any past performance, prediction, projection or forecast on the economy or markets are not necessarily indicative of the future or likely performance of the portfolio or UOBAM. Portfolio returns on the scheme is calculated on a single pricing basis.
1. Very Conservative portfolio
| Period | Portfolio Return (%) |
| 3 months | 0.3 |
| 6 months | 1.3 |
| 1 year | 3.4 |
Source: UOBAM as of 31 December 2025
The information about asset allocation provided herein are subject to change at the discretion of UOBAM without prior notice. Past performance of the portfolio or UOBAM and any past performance, prediction, projection or forecast on the economy or markets are not necessarily indicative of the future or likely performance of the portfolio or UOBAM. Returns are calculated on a single pricing basis.
For the three-month period ending 31 December 2025, this portfolio was up 0.3 percent. Asia investment-grade bonds contributed to the bulk of the returns.
Over the one-year period, the portfolio gained 3.4 percent. Asia investment-grade bonds contributed to the bulk of the returns.
2. Conservative portfolio
| Period | Portfolio Return (%) |
| 3 months | 0.4 |
| 6 months | 3.4 |
| 1 year | 5.2 |
Source: UOBAM as of 31 December 2025
The information about asset allocation provided herein are subject to change at the discretion of UOBAM without prior notice. Past performance of the portfolio or UOBAM and any past performance, prediction, projection or forecast on the economy or markets are not necessarily indicative of the future or likely performance of the portfolio or UOBAM. Returns are calculated on a single pricing basis.
For the three-month period ending 31 December 2025, this portfolio was up 0.4 percent. The largest contributor was Asian equities while Singapore government bonds detracted.
Over the one-year period, the portfolio gained 5.2 percent. The largest contributor was Singapore government bonds while the smallest contributor was global equities.
3. Moderate portfolio
| Period | Portfolio Return (%) |
| 3 months | 1.1 |
| 6 months | 4.7 |
| 1 year | 6.1 |
Source: UOBAM as of 31 December 2025
The information about asset allocation provided herein are subject to change at the discretion of UOBAM without prior notice. Past performance of the portfolio or UOBAM and any past performance, prediction, projection or forecast on the economy or markets are not necessarily indicative of the future or likely performance of the portfolio or UOBAM. Returns are calculated on a single pricing basis.
For the three-month period ending 31 December 2025, the portfolio was up 1.1 percent. The largest contributor was US equities while the smallest contributor was Asia investment-grade bonds.
Over the one-year period, the portfolio gained 6.1 percent. The largest contributor was Asia equities while global equities was the largest detractor.
4. Aggressive portfolio
| Period | Portfolio Return (%) |
| 3 months | 1.7 |
| 6 months | 7.0 |
| 1 year | 8.1 |
Source: UOBAM as of 31 December 2025
The information about asset allocation provided herein are subject to change at the discretion of UOBAM without prior notice. Past performance of the portfolio or UOBAM and any past performance, prediction, projection or forecast on the economy or markets are not necessarily indicative of the future or likely performance of the portfolio or UOBAM. Returns are calculated on a single pricing basis.
For the three-month period ending 31 December 2025, this portfolio was up 1.7 percent. The largest contributor was Asian equities while the smallest contributor was Asia investment-grade bonds.
Over the one-year period, the portfolio gained 8.1 percent. The largest contributor was Asia equities while global high-yield bonds was the largest detractor.
5. Very Aggressive portfolio
| Period | Portfolio Return (%) |
| 3 months | 2.1 |
| 6 months | 9.5 |
| 1 year | 11.4 |
Source: UOBAM as of 31 December 2025
The information about asset allocation provided herein are subject to change at the discretion of UOBAM without prior notice. Past performance of the portfolio or UOBAM and any past performance, prediction, projection or forecast on the economy or markets are not necessarily indicative of the future or likely performance of the portfolio or UOBAM. Returns are calculated on a single pricing basis.
For the three-month period ending 31 December 2025, the portfolio was up 2.1 percent. The largest contributor was Asian equities while the smallest contributor was Asia investment-grade bonds.
Over the one-year period, the portfolio gained 11.4 percent. The largest contributor was Asia equities while global high-yield bonds detracted.
As we move into 2026, economic conditions are becoming more supportive. Fiscal and monetary policy are expected to turn more accommodative, with new tax incentives and further rate cuts following those implemented at the end of 2025. The drag from tariffs on global growth is likely to fade by mid-year, while corporate fundamentals remain strong. Consensus forecasts for 2026 earnings growth stand at 13 percent for the US, 11 percent for Europe, 10 percent for Japan, and 18 percent for Asia ex-Japan, reinforcing a constructive outlook for global markets.
Strong corporate profit growth and improving productivity underpin expectations for continued market resilience. Historically, double-digit earnings growth tends to align with strong equity performance, and companies today are generally maintaining margins with lower leverage compared to previous high-valuation periods. These dynamics suggest the current expansion cycle could extend for another one to two years, supported by ongoing investment in technology and AI.
Across Asia, a growing middle class, attractive valuations, and currency strength remain key pillars of support. In China, liquidity conditions, anti-involution measures, and more measured consumer policies are expected to sustain market performance, with the extension of the US tariff pause to November 2026 providing additional relief. India may encounter headwinds as US tariffs weigh on near-term growth, while valuations in Taiwan and Korea appear stretched after strong tech-sector performance, prompting a more cautious stance.
Global bond markets are expected to remain stable, with US 10-year Treasury yields projected to trade between 4.0 percent and 4.5 percent in Q1 2026. The Fed funds rate is expected to decline toward 3.25 percent by mid-year, supporting a neutral stance on duration. We favour investment-grade developed market credit as developed market economies continue to demonstrate resilience. However, heightened policy uncertainty in the US and ongoing geopolitical risks warrant a prudent approach. While high-yield names may offer wider spreads, they are more exposed to macro shocks and external funding pressures, whereas investment-grade bonds are better positioned to weather volatility.
With economic risks fading and corporate earnings remaining healthy, we expect the market expansion cycle to continue and are shifting to a modest equity overweight. Within equities, we maintain an overweight in Asia and are upgrading our outlook on the US market to positive, supported by improving profit margins from technological innovation and productivity gains. We continue to monitor inflation dynamics, labour-market trends, and tariff developments closely, standing ready to adjust our positioning as conditions evolve.
1 July 2025 to 30 September 2025
1 January 2025 to 31 March 2025
1 October 2024 to 31 December 2024
30 June 2024 to 30 September 2024
1 January 2024 to 31 March 2024
1 October 2023 to 31 December 2023
1 July 2023 to 30 September 2023
1 January 2023 to 31 March 2023
1 October 2022 to 31 December 2022
1 January 2022 to 31 March 2022
1 July 2021 to 31 December 2021
MSCI Data are exclusive property of MSCI. MSCI Data are provided “as is”, MSCI bears no liability for or in connection with MSCI Data. Please see complete MSCI disclaimer here.
This document is for your general information only. It does not constitute investment advice, recommendation or an offer or solicitation to deal in Exchange Traded Funds ("ETFs") or in units in any Unit Trusts ("Unit Trusts", ETFs and Unit Trusts shall together be referred to as "Fund(s)") nor does it constitute any offer to take part in any particular trading or investment strategy.
This document was prepared without regard to the specific objectives, financial situation or needs of any particular person who may receive it. The information is based on certain assumptions, information and conditions available as at the date of this document and may be subject to change at any time without notice. If any information herein becomes inaccurate or out of date, we are not obliged to update it. No representation or promise as to the performance of the Fund or the return on your investment is made. Past performance of any Fund or UOB Asset Management Ltd ("UOBAM") and any past performance, prediction, projection or forecast of the economic trends or securities market are not necessarily indicative of the future or likely performance of the Fund or UOBAM. The value of any Fund and the income from them, if any, may fall as well as rise, and may have high volatility due to the investment policies and/or portfolio management techniques employed by the Fund. Investments in any Fund involve risks, including the possible loss of the principal amount invested, and are not obligations of, deposits in, or guaranteed or insured by United Overseas Bank Limited ("UOB"), UOBAM, or any of their subsidiary, associate or affiliate ("UOB Group") or distributors of the Fund. Market conditions may limit the ability of the platform to trade and investments in non-Singapore markets may be subject to exchange rate fluctuations. The Fund may use or invest in financial derivative instruments and you should be aware of the risks associated with investments in financial derivative instruments which are described in the respective Fund’s prospectus. The UOB Group may have interests in the Funds and may also perform or seek to perform brokering and other investment or securities-related services for the Fund. Investors should read the Fund’s prospectus, which is available and may be obtained from UOBAM or any of its appointed agents or distributors, before investing. You may wish to seek advice from a financial adviser before making a commitment to invest in any Funds, and in the event that you choose not to do so, you should consider carefully whether the Fund is suitable for you. Any reference to any specific country, financial product or asset class is used for illustration or information purposes only and you should not rely on it for any purpose. We will not be responsible for any loss or damage arising directly or indirectly in connection with, or as a result of, any person acting on any information provided in this document. Services offered by UOBAM Invest are subject to the UOBAM Invest Terms and Conditions.
This advertisement has not been reviewed by the Monetary Authority of Singapore.
UOB Asset Management Ltd Co. Reg. No. 198600120Z