


You are now reading:
Living with 5% Treasury yields: Why higher rates may not derail equities

Tel:
• 6532 7988
Complaint Management
• Hotline: 1800 22 22 228
• Calling from overseas: +65 6222 2228
Tel:
• 6532 7988
Complaint Management
• Hotline: 1800 22 22 228
• Calling from overseas: +65 6222 2228
Tel:
• 6532 7988
Complaint Management
• Hotline: 1800 22 22 228
• Calling from overseas: +65 6222 2228
Tel:
• 6532 7988
Complaint Management
• Hotline: 1800 22 22 228
• Calling from overseas: +65 6222 2228

you are in UOB Asset Management


You are now reading:
Living with 5% Treasury yields: Why higher rates may not derail equities
After years of ultra-low interest rates, investors are entering a markedly different market environment. US Treasury yields have steadily moved higher over recent years, and the 10-year Treasury yield recently rose to a near three-year high of 4.81 percent. Although it has since cooled down slightly, sustaining levels around 5 percent is an increasingly plausible scenario because of the US fiscal deficit and persistent inflation.
This shift has prompted concerns that higher yields could undermine equity markets by compressing valuations, raising financing costs and tightening financial conditions. Some investors have identified 10-year Treasury yields above 5.25 percent, or 30-year yields above 5.50 percent, as potential signals to reduce equity exposure.
However, we do not think that these yield levels should automatically be interpreted as a warning sign for equities. While higher Treasury yields are likely to create periods of market volatility and influence leadership across sectors, we believe the relationship between yields and equity performance is more nuanced. The evidence suggests that economic growth, corporate earnings and bond market stability may ultimately matter more than the absolute level of yields themselves.
Before examining the investment implications, it is worth revisiting why today's environment differs from previous periods when Treasury yields were last at similar levels.
The last time the US 10-year Treasury yield traded above 5.25 percent was in 2007, while yields above 5.50 percent were last seen in 2001. At first glance, it looks like we are now approaching an environment similar to those periods.
However, we think that the economic backdrop and market structure have changed significantly since then.
The US economy has experienced unprecedented fiscal support in recent years, with roughly US$6 trillion of fiscal stimulus helping to support growth during and after the COVID pandemic. The effects have extended well beyond the United States. Global growth recovered strongly, with the share of negative-yielding sovereign debt falling dramatically from about 75 percent to now less than 5 percent, and even Japan has emerged from decades of persistent deflationary pressures.
At the same time, equity markets have undergone a remarkable expansion. The S&P 500 has more than tripled from its pandemic lows and has risen substantially since the end of 2019. Against this backdrop, simply comparing today's market with previous periods of high yields may overlook the unique characteristics of the current cycle.
One reason markets have been able to absorb higher interest rates is that the financial position of both households and corporations remains relatively healthy.
US household balance sheets continue to benefit from elevated cash holdings and manageable debt service burdens by historical standards. Strong household finances help support consumption, which remains the primary driver of economic activity in the United States.
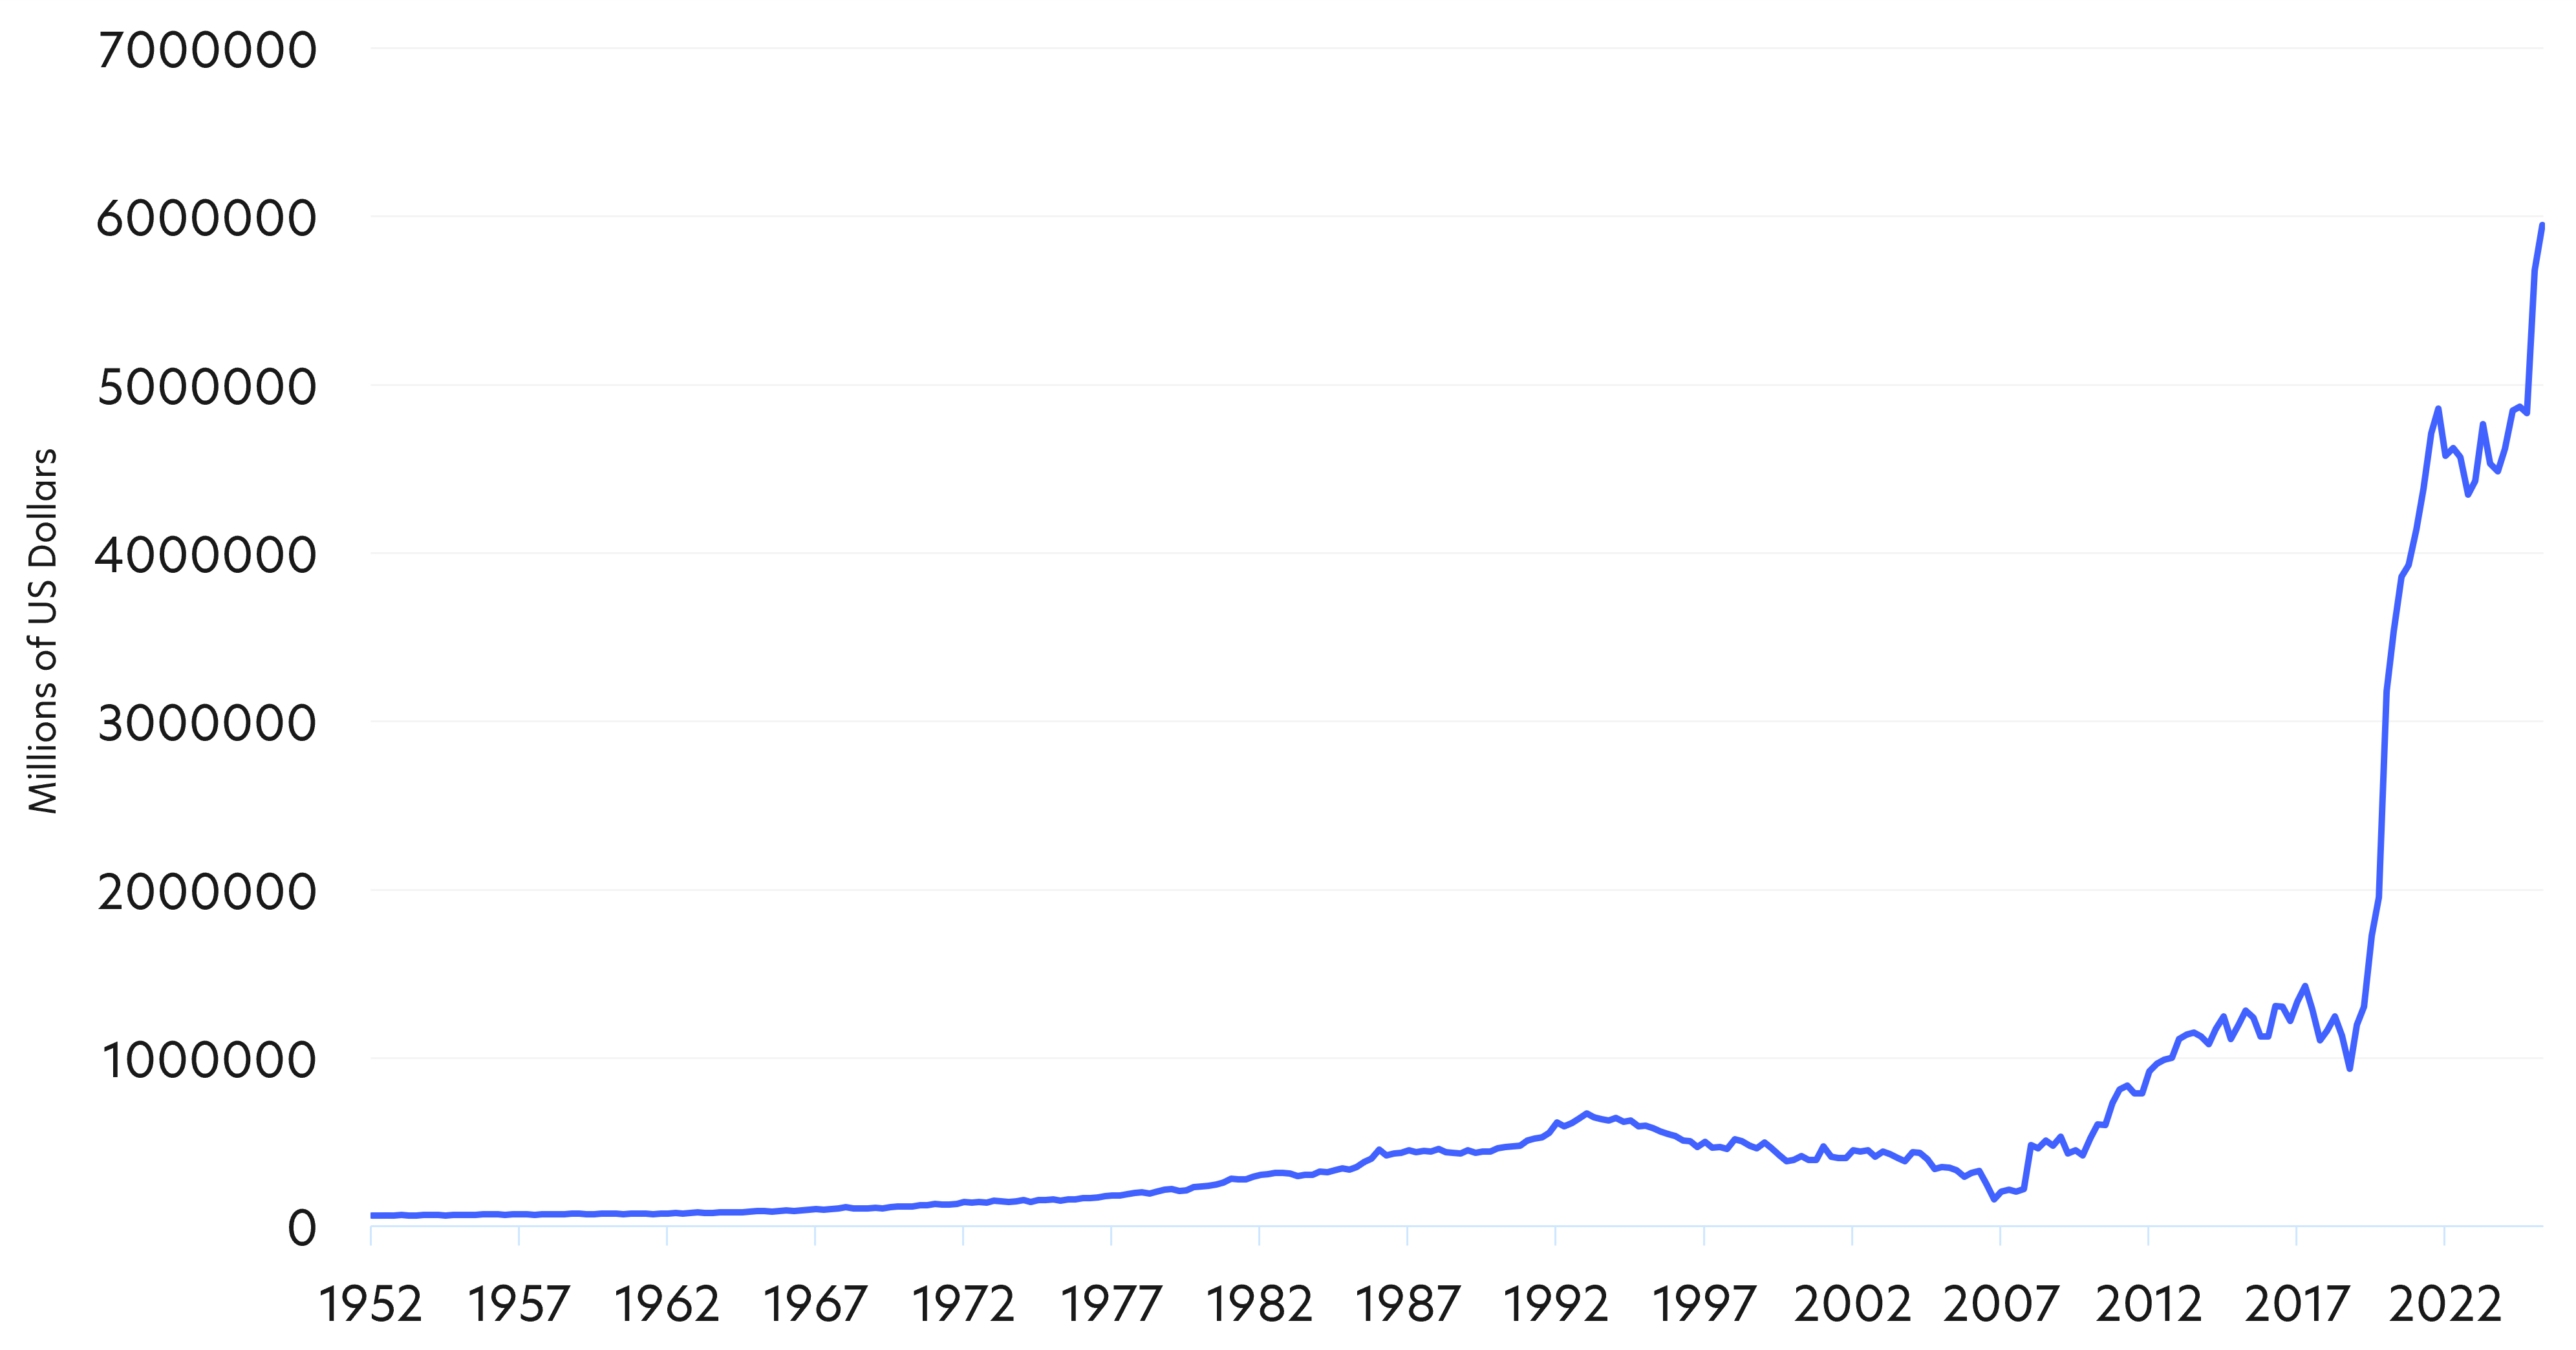
Source: Board of Governors of the Federal Reserve System (US) via FRED, retrieved 7 September 2026, data as of 1 January 2026
Corporate fundamentals also remain resilient. Credit coverage metrics across many companies remain near or above long-term averages, indicating that businesses generally retain the capacity to service their debt obligations despite higher borrowing costs.
More importantly, rising debt levels have not materially impaired corporate earnings generation. In some cases, companies carrying higher debt levels have generated higher earnings growth, reflecting the broader strength of economic activity and the ability of many businesses to adapt to a higher-rate environment.
Together, these factors suggest that the economy may be better positioned to absorb elevated rates than other times in history when rates were at similar levels.
Instead of focusing on the absolute level of Treasury yields, the more important consideration may be the volatility of bond markets.
While yield levels may create shifts in market leadership, rapid yield changes tend to create uncertainty across financial markets as investors reduce risk appetite, adjust valuation assumptions and reposition portfolios. Historically, when the US 10-year Treasury yield reaches new cycle highs, markets often require approximately eight weeks to fully absorb the change.
Therefore, investors may need to focus less on whether Treasury yields cross specific numerical thresholds and more on whether bond market conditions remain orderly.
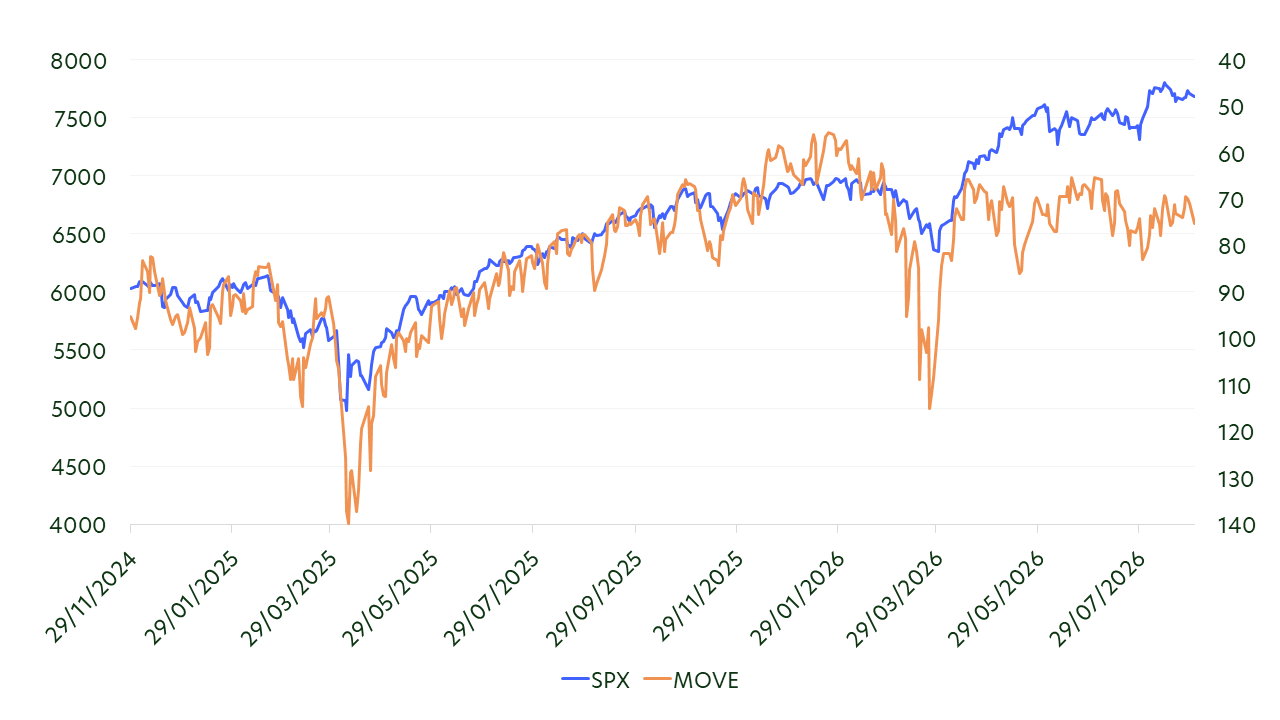
Source: Bloomberg, data as of 31 August 2026. Note: The MOVE Index (Merrill Lynch Option Volatility Estimate), now officially known as the ICE BofA MOVE Index, measures the market’s expected volatility in US Treasury yields over the next month based on Treasury option prices.
An important historical reference comes from the 1990s. During that decade, the US 10-year Treasury yield averaged approximately 6.65 percent, substantially higher than current levels. Despite this, equity markets delivered strong returns, supported by robust economic growth, productivity gains and rising corporate profitability. In particular, companies with larger market capitalisation tended to be more resilient than their counterparts with smaller market capitalisation.
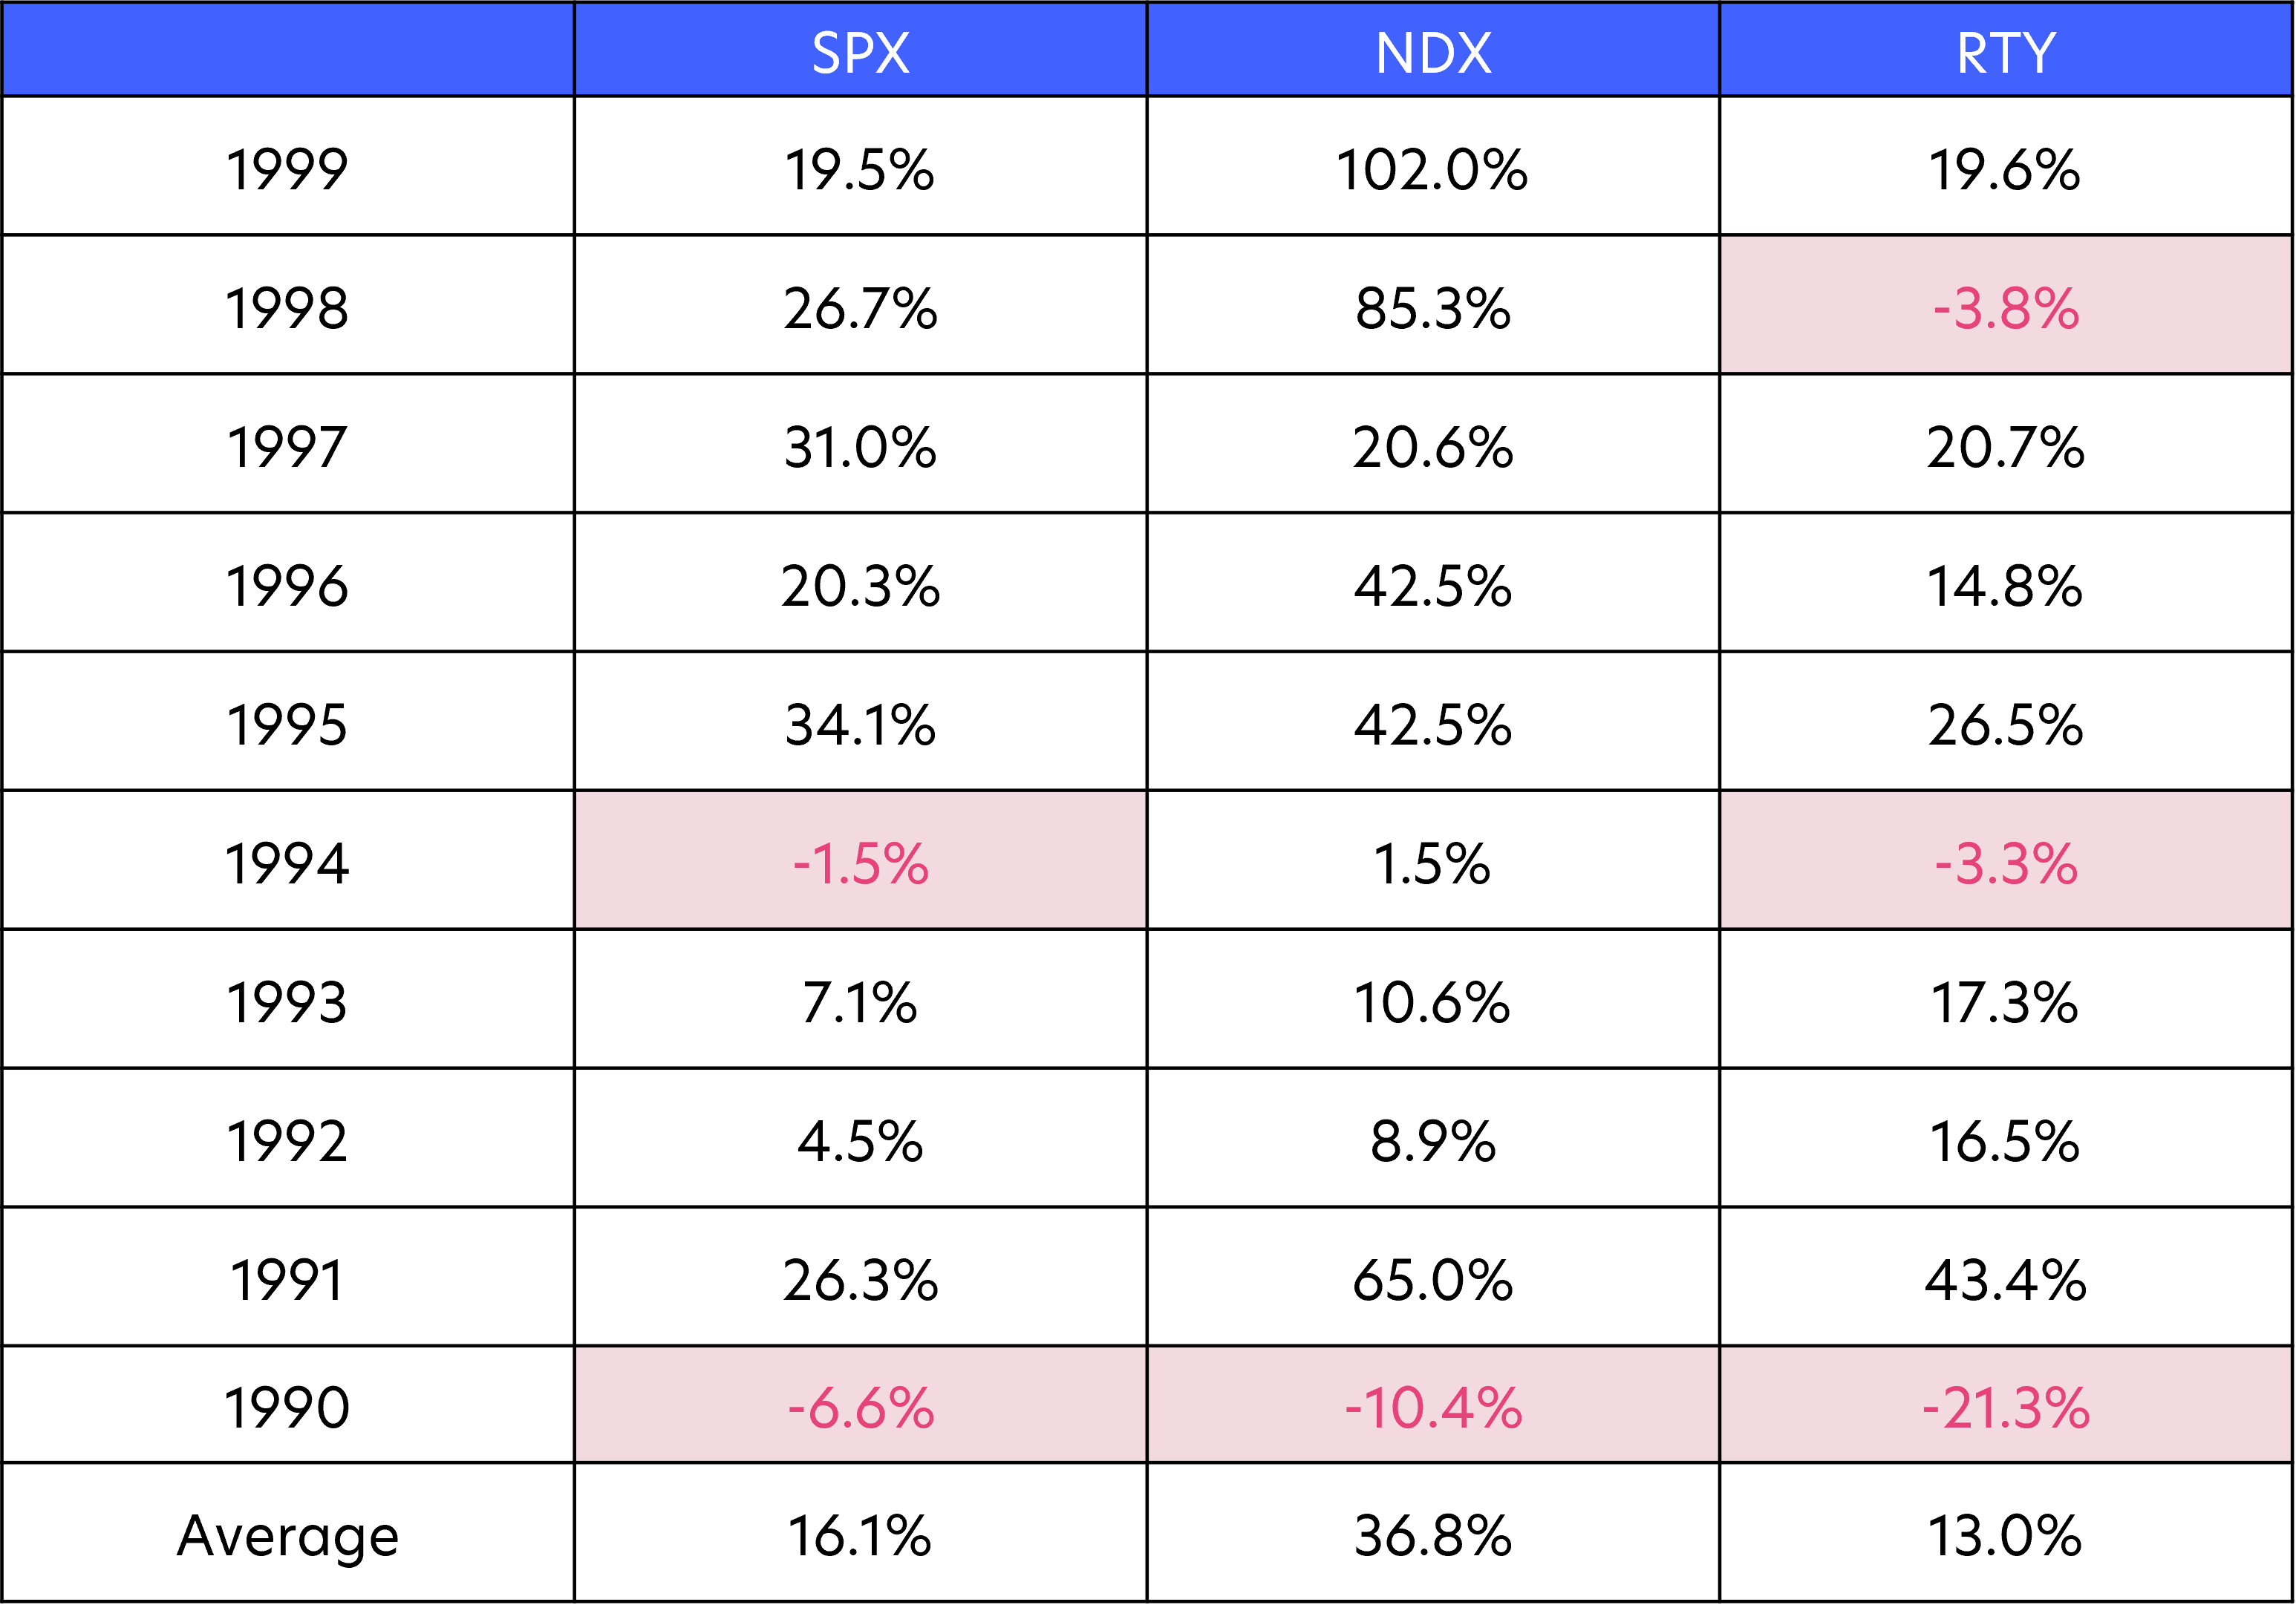
Source: JPM Market Intel, Bloomberg.
Note: The S&P 500 Index represents 500 of the largest large-cap US companies, the Nasdaq-100 represents 100 of the largest non-financial companies listed on the Nasdaq stock exchange, and the Russell 2000 Index represents 2,000 small-cap US companies.
The experience highlights an important principle: higher yields do not necessarily prevent equities from performing well if underlying growth remains sufficiently strong.
This may be particularly relevant today. While higher yields can place pressure on valuations, sustained earnings growth can offset much of that headwind. If economic activity remains resilient and companies continue to generate healthy profits, equity markets may be able to adapt to a world where Treasury yields remain structurally higher than investors became accustomed to during the previous decade.
The transition to a higher-yield environment will not be without challenges. Market leadership is likely to broaden, sector performance may become more differentiated, and periods of volatility should be expected as investors adjust to a new interest-rate regime.
However, a 5 percent Treasury yield no longer automatically implies an equity bear market.
Instead, the key question is whether economic growth remains strong enough to support corporate earnings and offset valuation pressures. Current household and corporate fundamentals suggest that the economy retains considerable resilience, even as borrowing costs remain elevated.
At the same time, investors should pay close attention to bond market volatility and concerns surrounding long-term fiscal sustainability, as these factors may ultimately present a greater risk than the absolute level of Treasury yields.
While the coming months may test markets' ability to adapt to higher rates, history suggests that equities can perform well even in environments where Treasury yields are meaningfully above today's levels. If growth continues to hold up, investors may find that living with 5 percent Treasury yields is more manageable than many initially feared.

All information in this publication is based upon certain assumptions and analysis of information available as at the date of the publication and reflects prevailing conditions and UOB Asset Management Ltd (“UOBAM”)'s views as of such date, all of which are subject to change at any time without notice. Although care has been taken to ensure the accuracy of information contained in this publication, UOBAM makes no representation or warranty of any kind, express, implied or statutory, and shall not be responsible or liable for the accuracy or completeness of the information.
Potential investors should read the prospectus of the fund(s) (the “Fund(s)”) which is available and may be obtained from UOBAM or any of its appointed distributors, before deciding whether to subscribe for or purchase units in the Fund(s). Returns on the units are not guaranteed. The value of the units and the income from them, if any, may fall as well as rise, and is likely to have high volatility due to the investment policies and/or portfolio management techniques employed by the Fund(s).
Please note that the graphs, charts, formulae or other devices set out or referred to in this document cannot, in and of itself, be used to determine and will not assist any person in deciding which investment product to buy or sell, or when to buy or sell an investment product. An investment in the Fund(s) is subject to investment risks and foreign exchange risks, including the possible loss of the principal amount invested. Investors should consider carefully the risks of investing in the Fund(s) and may wish to seek advice from a financial adviser before making a commitment to invest in the Fund(s). Should you choose not to seek advice from a financial adviser, you should consider carefully whether the Fund(s) is suitable for you. Investors should note that the past performance of any investment product, manager, company, entity or UOBAM mentioned in this publication, and any prediction, projection or forecast on the economy, stock market, bond market or the economic trends of the markets is not necessarily indicative of the future or likely performance of any investment product, manager, company, entity or UOBAM or the economy, stock market, bond market or economic trends of the markets. Nothing in this publication shall constitute a continuing representation or give rise to any implication that there has not been or that there will not be any change affecting the Funds. All subscription for the units in the Fund(s) must be made on the application forms accompanying the prospectus of that fund.
The above information is strictly for general information only and is not an offer, solicitation advice or recommendation to buy or sell any investment product or invest in any company. This publication should not be construed as accounting, legal, regulatory, tax, financial or other advice. Investments in unit trusts are not obligations of, deposits in, or guaranteed or insured by United Overseas Bank Limited, UOBAM, or any of their subsidiary, associate or affiliate or their distributors. The Fund(s) may use or invest in financial derivative instruments and you should be aware of the risks associated with investments in financial derivative instruments which are described in the Fund(s)’ prospectus.
This advertisement has not been reviewed by the Monetary Authority of Singapore.
UOB Asset Management Ltd Co. Reg. No. 198600120Z