You are now reading:
Asia AI-Augmented Insights | December 2025

Tel:
• 6532 7988
Complaint Management
• Hotline: 1800 22 22 228
• Calling from overseas: +65 6222 2228
Tel:
• 6532 7988
Complaint Management
• Hotline: 1800 22 22 228
• Calling from overseas: +65 6222 2228
Tel:
• 6532 7988
Complaint Management
• Hotline: 1800 22 22 228
• Calling from overseas: +65 6222 2228
Tel:
• 6532 7988
Complaint Management
• Hotline: 1800 22 22 228
• Calling from overseas: +65 6222 2228
you are in UOB Asset Management![]()


You are now reading:
Asia AI-Augmented Insights | December 2025
Asian equity markets (MSCI Asia ex Japan Index, SGD terms) gained 2.0 percent in December, recouping much of November’s losses and ending 2025 near record highs. Gains were driven mainly by South Korea, Taiwan, China and ASEAN. There was a brief period of volatility as the Hong Kong markets dipped on renewed concerns about China’s economy, but this was offset by a surge in AI-related tech stocks.
South Korea’s market outperformed as SK Hynix surged nearly 23 percent and Samsung Electronics gained 19 percent, fuelled by a rebound in AI chip demand and improving sentiment.
Taiwan equities mirrored Korea’s trajectory, with strong momentum among leading chipmakers on sustained AI related semiconductor demand.
Hong Kong’s market slipped as pharmaceutical and biotech names declined sharply alongside several large cap banks.
Mainland China equities posted modest gains despite fresh signs of stalling economic growth. Investment decelerated sharply, money supply contracted, and retail sales growth cooled. Industrial output grew 4.8 percent, below forecasts and October’s pace. While a statistical correction and the end of a white goods incentive scheme may have skewed some prints, economists cautioned that industrial sectors could face more pressure next year from rising trade barriers.
Inflation trends were mixed. The Consumer Price Index (CPI) rose to a 21 month high, core inflation steadied, while the Producer Price Index (PPI) deteriorated. New home prices fell again.
On the positive end, exports rebounded after October’s surprise dip and imports rose, delivering a year to date trade surplus above US$ 1 trillion. December’s official and private manufacturing Purchasing Managers’ Indexes (PMIs) expanded for the first time in months, defying expectations of further contraction.
In contrast, ASEAN markets proved more resilient. Indonesia’s benchmark reached record highs, while Singapore, Malaysia, and the Philippines also posted advances, with the latter breaking a six-month losing streak.
Malaysia surprised with strong gains on robust economic indicators signalling continued growth, while Singapore’s Straits Times Index (STI) also registered notable gains to end near record highs.
India’s NSE Nifty 50 (Nifty) and S&P BSE Sensex (Sensex) fell amid continued foreign investor outflows and a record low rupee, dampening risk appetite.
China left its 1 year and 5 year Loan Prime Rates unchanged as expected, while the US delayed new tariffs on chip exports to China for another 18 months.
November exports from Singapore, South Korea, Taiwan, and India beat forecasts despite US tariff headwinds. However, PMI data for the month showed further manufacturing contraction in South Korea, Taiwan, and China, slower growth in India, and expansion across ASEAN.
Indonesia and the US prepared to sign a full trade agreement in late January 2026.
Thailand dissolved parliament, triggering elections by end January 2026. Meanwhile, its border tensions with Cambodia eased after a ceasefire.
United Asia Fund
| 1M | 1Y | 3Y | |
| United Asia Fund | 3.87% | 17.66% | 12.12% |
| Benchmark | 2.00% | 24.68% | 14.59% |
Source: Morningstar. Performance as of 31 December 2025, SGD basis, with dividends and distributions reinvested, if any. Fund refers to United Asia Fund – A SGD Acc. Benchmark: April 1992 – December 2011: MSCI AC FE ex-Japan; January 2012 to present: MSCI AC Asia ex-Japan. Performance figures for 1 month till 1 year show the per cent change, while performance figures above 1 year show the average annual compounded returns.
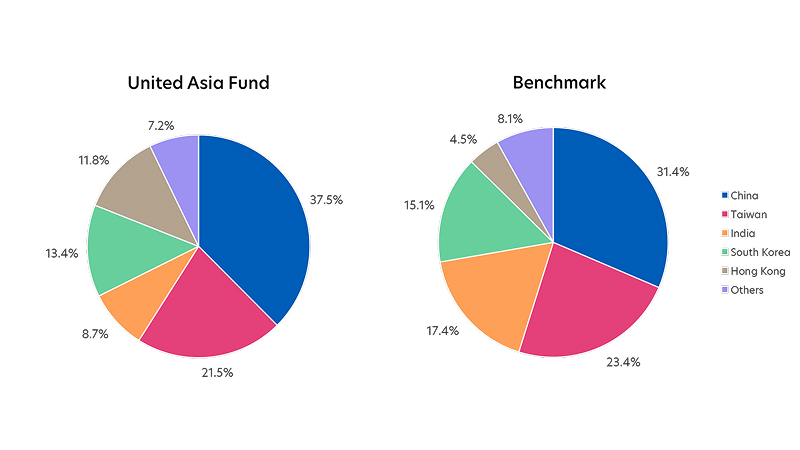
Source: Morningstar. Portfolio rebalancing as of 31 December 2025. Benchmark allocation as of 31 December 2025
Click here for more details on the Fund above.
United Greater China Fund
| 1M | 1Y | 3Y | |
| United Greater China Fund | 2.20% | 29.16% | 14.02% |
| Benchmark | 0.77% | 26.73% | 16.10% |
Source: Morningstar. Performance as of 31 December 2025, SGD basis, with dividends and distributions reinvested, if any. Fund refers to United Greater China Fund – A SGD Acc. Benchmark: MSCI Golden Dragon Index. Performance figures for 1 month till 1 year show the per cent change, while performance figures above 1 year show the average annual compounded returns.
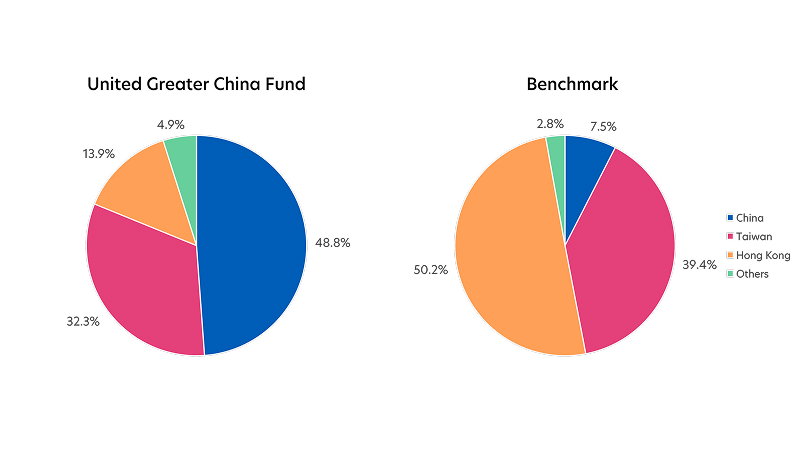
Source: Morningstar. Portfolio rebalancing as of 31 December 2025. Benchmark allocation as of 31 December 2025. Note: Differences in country allocation between the Fund and Benchmark may arise from differing country classification methodologies which define Hong Kong-listed Chinese companies differently
Click here for more details on the Fund above.
United ASEAN Fund
| 1M | 1Y | 3Y | |
| United ASEAN Fund | 2.59% | 7.91% | 7.11% |
| Benchmark | 1.25% | 9.92% | 7.96% |
Source: Morningstar. Performance as of 31 December 2025, SGD basis, with dividends and distributions reinvested, if any. Fund refers to United ASEAN Fund – A SGD Acc. Benchmark: Jun 86 - Jan 93: 100% DBS 50; Feb 93 - Aug 98: 50% DBS 50, 50% KLEMAS; Sep 98 - May 00: 100% DBS 50; June 00 - May 06: 50% STI Index, 50% KLEMAS; June 06 - June 13: 50% STI Index, 50% KLCI; Jul 13 - present: MSCI ASEAN. Performance figures for 1 month till 1 year show the per cent change, while performance figures above 1 year show the average annual compounded returns.
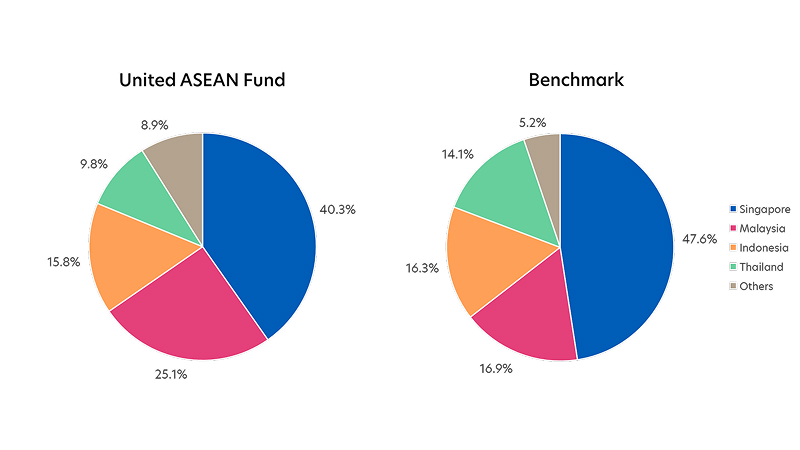
Source: Morningstar. Portfolio rebalancing as of 31 December 2025. Benchmark allocation as of 31 December 2025
Click here for more details on the Fund above.

02 Apr 2026 •

23 Dec 2025 •

26 Sep 2025 •