

Key Highlights
- As the Covid-effect fades, there is fresh interest in “old-school” value sectors
- The financials, energy and material sectors stand to benefit from interest rate rises
- Short term sector tilts are useful, but be careful to remain well diversified
Big tech’s star may be fading
Its been a dramatic start to the year for the Nasdaq. Having lost close to 16 percent of its value over several weeks, the index climbed on bargain hunting, only to be dragged down by Facebook’s parent company, Meta Platforms. The release of surprisingly weak earnings tarnished other social media giants, but the markets bounced back after Amazon came to the rescue with uplifting news on its forth quarter earnings.
Clearly markets have not fallen out of love with big tech names, but the Covid-driven honeymoon appears to be over. Investors with higher risk appetites are becoming less tolerant of earnings disappointments, while the current volatility is nudging those with lower risk appetites to search for alternatives.
Value back in favour
As the chart below shows, the MSCI US Growth index strongly outperformed strongly during the first year of the Covid outbreak. Contributors to these gains were concentrated in just a few well-known mega-cap names of which the five largest – Apple, Microsoft, Amazon, Meta Platforms and Tesla – accounted for over a third of the US market’s returns.
The Value sector outperformed the market in the first half of 2021, but surrendered its leadership in the second half. However, with interest rates expected to rise globally, and the world set to enter a period of more measured growth, the value sector has staged a comeback since November 2021.
Figure 1: Value is outperforming growth
Rolling 65D MSCI Growth minus MSCI Value index returns
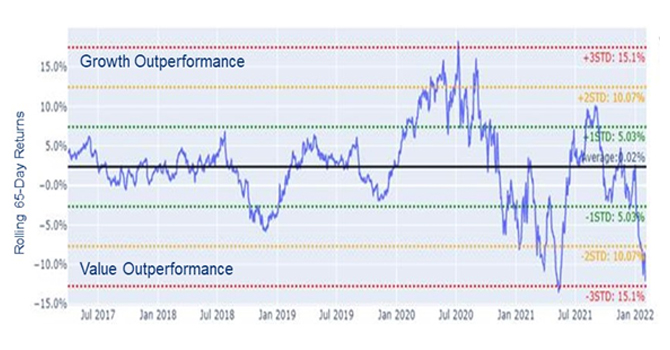
Source: UOBAM/FactSet, 7 Feb 2022
As mentioned in previous Research Notes, inflationary pressures have caused the US Fed to signal a period of rate hikes starting in March 2022 and projected to proceed in 25 basis point steps three more times this year, and three times next year. This would bring US overnight rates from near zero to close to 2 percent by the start of 2024.
These higher rates do not necessarily harm overall equity market returns, but there is a tendency for volatility to increase as investors transition away from sectors that are likely to be disadvantaged and/or have already experienced outsized gains. Instead, in this environment, equity investors tend to gravitate instead to inexpensive sectors that stand to benefit from the rising rates cycle.
Key value sectors
Reasonably priced financials, energy and materials stocks are thought to be the primary beneficiaries of a rotation back to value.
Financial companies are the most obvious example of a sector with potential for an earnings boost from higher short and long term yields. This typically results from larger revenue-generating spreads between deposit and lending rates, plus banks already have plenty of excess cash in the wake of Covid.
In addition to financials, there is typically good correlation between rising interest rates. and the energy and materials sector. These oil and gas, mining, metals and minerals businesses are able to benefit from the higher commodity prices that have resulted from post-pandemic supply chain disruptions. Part of the “cyclical” super-sector, such companies are sensitive to the mid-stage global economic growth that we project for 2022. In addition, while there are differences in the Asia economic cycle compared to the one unfolding in the US and Europe, this cyclical theme has strong relevance across both developed and developing markets.
In the search for growth alternatives, the real estate and infrastructure sector offers investment dynamics that respond differently to the drivers of equity and bond markets. Such sectors are often viewed as a useful hedge against inflation, for example, real estate values and rents tend to increase in step with rising inflation.
Rotation versus diversification
The ascendency of the value sector is also the result of more attractive valuation spreads between growth and value stocks. Looking at their price-to-book and price-to-earning ratios, low volatility and high yielding stocks still offer attractive spreads within the value universe, despite recent buying. Should economic growth remain encouraging, we would expect smaller cap, quality names with good earnings potential to outperform.
Figure 2: Sector leadership can be fleeting
Top three factors by percentage return in SGD, 1Q21 – YTD
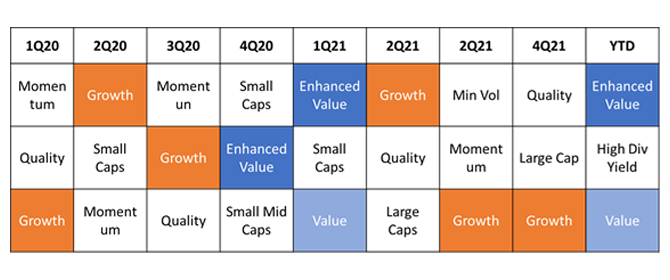
Source: UOBAM/MSCI, 7 Feb 2022
However, Figure 1 and Figure 2 tell us that while there are clear trends in the way markets rotate between sectors, there is a high degree of volatility involved. Within each period of sector leadership, whether growth or value, there can be large movements in the opposite direction. The period of sector leadership can also be relatively short-lived, typically lasting just a few quarters. Given this, investors may want to limit their sector tilts within an overall investment portfolio that is well diversified across asset classes, sectors and styles.
This publication shall not be copied or disseminated, or relied upon by any person for whatever purpose. The information herein is given on a general basis without obligation and is strictly for information only. This publication is not an offer, solicitation, recommendation or advice to buy or sell any investment product, including any collective investment schemes or shares of companies mentioned within. Although every reasonable care has been taken to ensure the accuracy and objectivity of the information contained in this publication, UOB Asset Management Ltd (“UOBAM”) and its employees shall not be held liable for any error, inaccuracy and/or omission, howsoever caused, or for any decision or action taken based on views expressed or information in this publication. The information contained in this publication, including any data, projections and underlying assumptions are based upon certain assumptions, management forecasts and analysis of information available and reflects prevailing conditions and our views as of the date of this publication, all of which are subject to change at any time without notice. Please note that the graphs, charts, formulae or other devices set out or referred to in this document cannot, in and of itself, be used to determine and will not assist any person in deciding which investment product to buy or sell, or when to buy or sell an investment product. UOBAM does not warrant the accuracy, adequacy, timeliness or completeness of the information herein for any particular purpose, and expressly disclaims liability for any error, inaccuracy or omission. Any opinion, projection and other forward-looking statement regarding future events or performance of, including but not limited to, countries, markets or companies is not necessarily indicative of, and may differ from actual events or results. Nothing in this publication constitutes accounting, legal, regulatory, tax or other advice. The information herein has no regard to the specific objectives, financial situation and particular needs of any specific person. You may wish to seek advice from a professional or an independent financial adviser about the issues discussed herein or before investing in any investment or insurance product. Should you choose not to seek such advice, you should consider carefully whether the investment or insurance product in question is suitable for you.