

- US investment-grade corporate bonds have pulled back since the start of February amid strong jobs data and hotter-than-expected US CPI data
- However, we expect strong technicals and robust corporate fundamentals to support credit spreads
- The search for yield is likely to underpin the corporate bond market in coming months
After rallying since the start of the year, US investment-grade (IG) corporate bonds, also known as credits, declined month-to-date. IG credits – as measured by the Bloomberg US Corporate Investment-grade Index – fell 2.06 percent.
The pullback followed hawkish commentary from the Federal Reserve, which came after an unexpectedly strong US jobs report. Sentiment was also dented after the recent US consumer price index (CPI) reading came slightly above market forecasts, a sign that inflation is likely to remain sticky.
Drivers of the bond market rally
Nevertheless, the drivers of January’s IG bond market rally are still in place and we expect these to reassert themselves in the months to come.
1. Soft landing outlook
The annual US inflation rate slowed to 6.4 percent in January, falling for the seventh consecutive month. Meanwhile, the US labour market remained resilient, with the January unemployment rate of 3.4 percent at its lowest since 1969.
These data points suggest that the Fed could indeed bring down inflation and pull off a US economic slowdown without triggering widespread unemployment. Such a soft landing scenario is particularly good news for IG bonds.
Over in Europe, a deep recession is also looking less likely given that mild winter weather is helping to relieve energy price pressures. Meanwhile China’s reopening has led to a rebound in the country’s manufacturing and services for the first time in four months. This could help buffer against a global recession.
2. Strong technicals
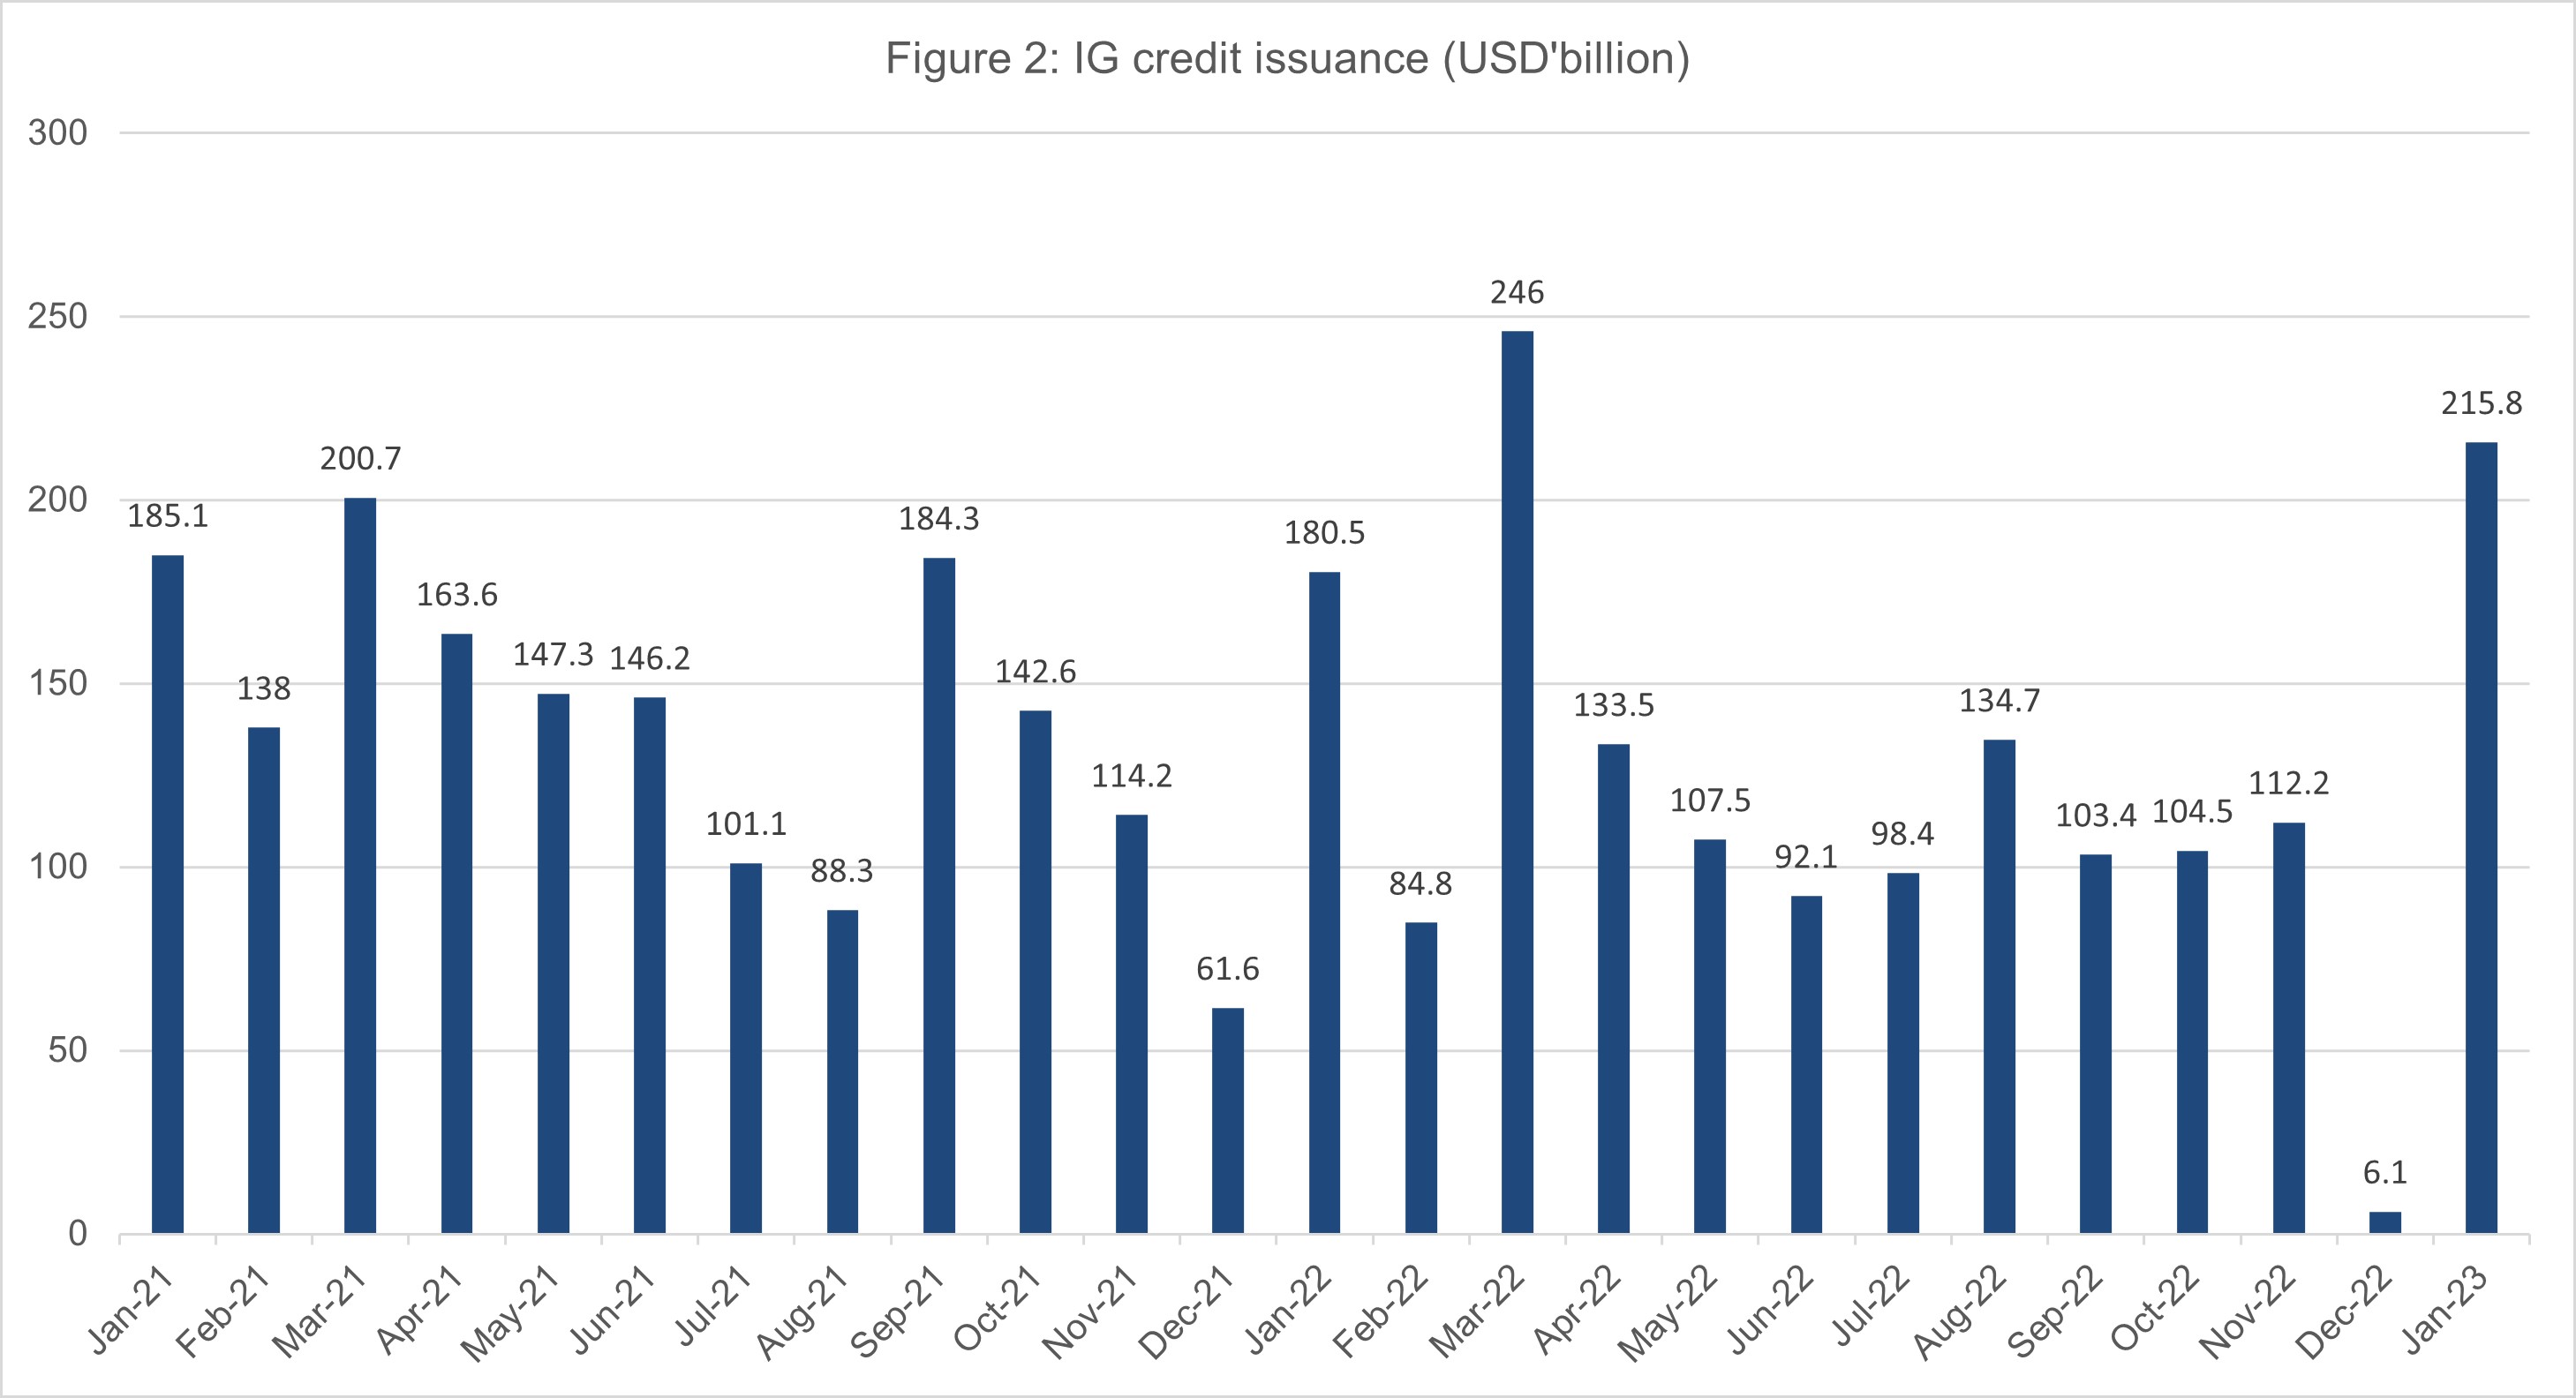
Source: Barclays, UOBAM
Issuers took advantage of the positive sentiments with January IG corporate bond issuance jumping to US$215.8 billion, a 3,400 percent surge from the previous month.
This is matched by strong demand. Weekly investment-grade fund flows have averaged US$5 billion since the start of the year, although net inflows have moderated in recent weeks, dampened by a decline in demand for bond ETFs (exchange traded funds). However, we see this decline as temporary with supply and demand set to recover in 2023.
3. Sound corporate fundamentals
Corporate fundamentals in the US remain solid, with balance sheets for many IG companies looking strong after these firms borrowed at low fixed interest rates during the pandemic.
While recent mixed earnings results could point towards a downward revision in growth expectations, we expect the default risk for IG bonds to remain low, especially when compared to high-yield bonds.
US IG Credit spreads review
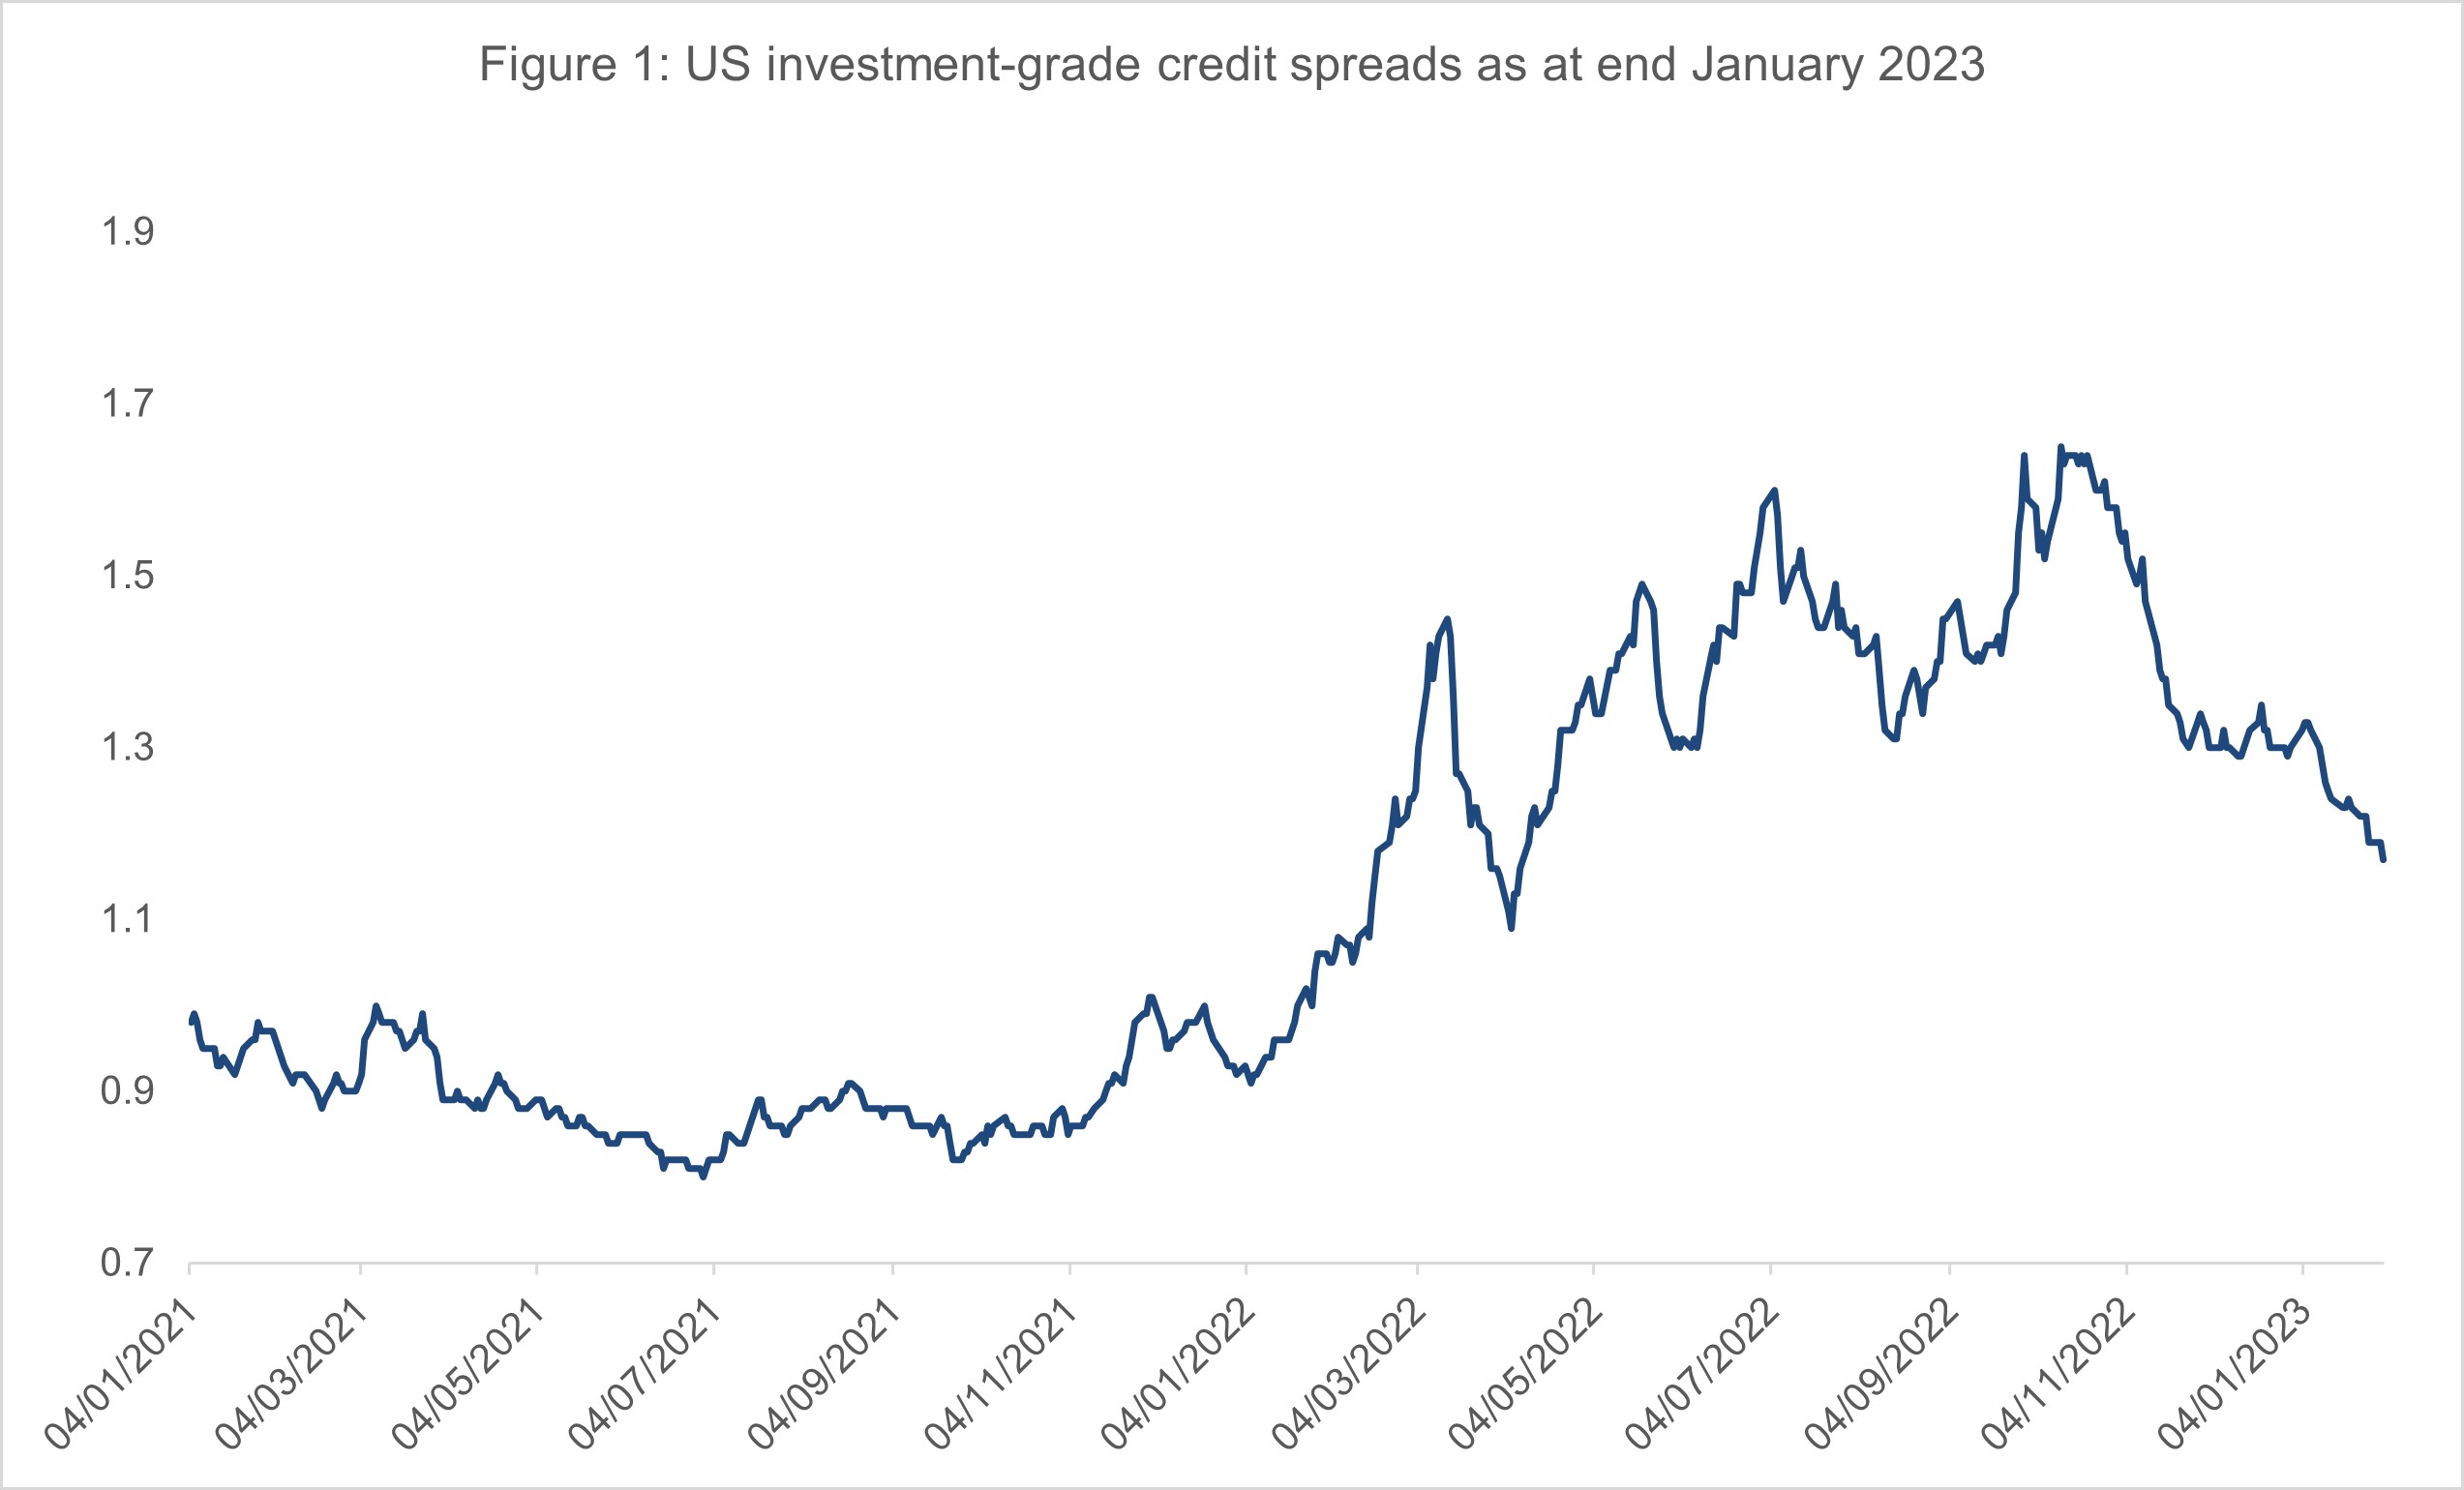
Source: Bloomberg
After widening throughout 2022 and reaching a peak of 165 basis points in October, credit spreads for US IG bonds tightened in January and ended the month at 117 basis points.
Credit spread is the difference between yields on corporate bonds and “risk-free” US Treasuries. Tighter spreads in January suggest that the corporate bond market assesses corporate bond risk relative to US Treasuries to be reducing. This means less additional yield over Treasury bonds but higher prices.
As a result, US IG corporates notched total returns of 4.01 percent in January, with a positive excess return of 1.20 percent over US Treasuries.
Top and Worst performers
Figure 3: US investment-grade breakdown by credit and tenor, Jan 2023
| Rating / Tenor | Month-on-month change | Month-to-date excess return |
| AAA | -3 bps | 0.68% |
| AA | -4 bps | 0.52% |
| A | -13 bps | 1.09% |
| BBB | -16 bps | 1.41% |
| 1-3 years | -13 bps | 0.29% |
| 3-5 years | -13 bps | 0.77% |
| 5-7 years | -16 bps | 1.03% |
| 7-10 years | -17 bps | 1.38% |
| 10-25 years | -14 bps | 1.86% |
| >25 years | -12 bps | 2.07% |
| US IG | -13 bps | 1.20% |
Source: WFC, UOBAM
In January, the top-performing corporate bond sectors were Media / Entertainment, Cable / Satellite, and Midstream Energy. These sectors saw capital gains of between 1.8 to 2.4 percent. On the other hand, consumer producers, retailers, and construction machinery manufacturers were the worst performing sectors with falls of 0.4 – 0.7 percent.
Going forward, we are positive on bonds issued by companies within the US financial sector. This sector is likely to benefit from the higher-for-longer interest rate regime. The IG telecoms sector is also a favourite given its defensive qualities in a slower economic climate.
Investment-grade bonds remain attractive for income seekers
While inflation seems to have peaked, current levels remain far from the Fed’s target rate of 2.0 percent. Our view is that the Fed Funds rate will be raised to 5.0 percent and then the Fed is expected to pause rate hikes to allow for an assessment of prevailing economic trends.
Although this may cause some near-term volatility in bond prices, we continue to maintain a favourable view on this sector given the investor demand for attractive bond yields.
At around 5.0 percent, investment-grade bond yields are now the highest since 2008. The asset class offers a sweet spot for investors seeking decent yield without the need to take on the greater default risk inherent in lower-rated bonds.
Potential risks
The pace and intensity of the Fed’s rate hikes this year will depend largely on economic data. Should the Fed fail to tame inflation, interest rates may have to be raised more than expected, bringing recession risks back to the fore.
This publication shall not be copied or disseminated, or relied upon by any person for whatever purpose. The information herein is given on a general basis without obligation and is strictly for information only. This publication is not an offer, solicitation, recommendation or advice to buy or sell any investment product, including any collective investment schemes or shares of companies mentioned within. Although every reasonable care has been taken to ensure the accuracy and objectivity of the information contained in this publication, UOB Asset Management Ltd (“UOBAM”) and its employees shall not be held liable for any error, inaccuracy and/or omission, howsoever caused, or for any decision or action taken based on views expressed or information in this publication. The information contained in this publication, including any data, projections and underlying assumptions are based upon certain assumptions, management forecasts and analysis of information available and reflects prevailing conditions and our views as of the date of this publication, all of which are subject to change at any time without notice. Please note that the graphs, charts, formulae or other devices set out or referred to in this document cannot, in and of itself, be used to determine and will not assist any person in deciding which investment product to buy or sell, or when to buy or sell an investment product. UOBAM does not warrant the accuracy, adequacy, timeliness or completeness of the information herein for any particular purpose, and expressly disclaims liability for any error, inaccuracy or omission. Any opinion, projection and other forward-looking statement regarding future events or performance of, including but not limited to, countries, markets or companies is not necessarily indicative of, and may differ from actual events or results. Nothing in this publication constitutes accounting, legal, regulatory, tax or other advice. The information herein has no regard to the specific objectives, financial situation and particular needs of any specific person. You may wish to seek advice from a professional or an independent financial adviser about the issues discussed herein or before investing in any investment or insurance product. Should you choose not to seek such advice, you should consider carefully whether the investment or insurance product in question is suitable for you.
UOB Asset Management Ltd. Company Reg. No. 198600120Z