

Key Highlights
- Potentially high inflation and slow growth increases the risk of stagflation
- In such an environment, traditional assets may underperform
- Investors may want to diversify their portfolios to include a range of alternative assets
The spectre of stagflation
Following Brent oil price rises to around US$130 per barrel this week, the threat of stagflation has shifted from whispers to warnings. Bank of Portugal governor, Mario Centeno, remarked in a recent interview that while he still expects European Union growth to continue despite the Ukrainian war, “a scenario close to stagflation is not out of the possibilities that we can face.”
Even further afield, former US Treasury Secretary Lawrence Summers conceded that the US was not facing the same high levels of inflation as in the 1970s, but “the same broad phenomena of stagflation” was becoming a real risk.
We would stress that stagflation is not UOBAM’s current base case. Even if energy prices were to stay elevated, we would note that the current inflationary conditions are also driven by Covid-induced supply bottlenecks that will likely be resolved in coming months. Company earnings are healthy globally and we do not detect signs of balance sheet deterioration. That said, we believe investors should diversify more broadly to provide increased defences against stagflation and other inflationary conditions, and we are doing the same with our portfolios.
Why is stagflation so bad?
Stagflation marks the coming together of two economic events: weak or slowing growth and yet, high or rising inflation. These two events typically do not happen at the same time because slowing economies tend to keep inflation anchored. However under unusual circumstances such as a war-induced supply shock, prices soar just when normal economic drivers are also being disrupted.
Stagflation greatly worries economists because the solutions are not immediately obvious. For example, when businesses cannot produce goods and services to meet demand, cutting interest rates can actually make things worse. The extra money simply flows through into even higher prices without improving company earnings, creating a downward spiral of recessionary conditions, poor company performance, increased unemployment and reduced spending power.
Investments rethink
A textbook stagflation scenario is not one that many investors will have encountered in their adult lives. However, drawing on the lessons of the 1970s stagflation period, it is possible to outline the following possibilities:
- Equities underperform as lower growth to lower expected earnings
- Equity valuations fall as risk premiums increase
- Bonds yields rise amid expectations of higher interest rates
- Credit spreads widen given the high inflation outlook
Given that both bond and equity returns tend to come under pressure in a stagflationary environment, it is useful to introduce limited investment exposures to non-mainstream assets. These instruments have a dual purpose. Some can potentially hedge against (ie gain from) the very price rises that are hurting other mainstream investments. Others provide the potential to take advantage of uncorrelated or less correlated market drivers and therefore diversify away from well-trodden paths.
Here are some investment options that can play such a role.
1. Gold and precious metals
S&P GSCI Precious Metals Index: 8 Mar 2021 – 7 Mar 2022
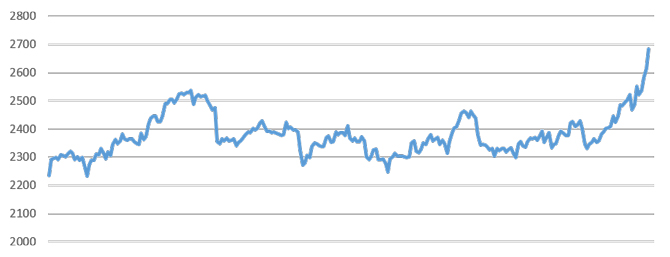
Source: S&P Dow Jones Indices
Real assets such as gold are typically a go-to asset in times of high inflation and market volatility. This week, after a tentative range bound performance earlier in the year, spot gold and US gold futures rose to their highest levels since September 2020. Other precious metals such as silver and platinum serve a similar purpose and have also been rising steadily.
Palladium was already in short supply prior to the Ukraine war and Russia accounts for about 40 per cent of global palladium production. Since this metal is used by automakers in catalytic converters to curb emissions, it is no surprise that supply concerns have pushed palladium prices to record highs. Stockpiling has also become a factor with reports that this was behind the extreme nickel deficits and margin calls this week.
However, investors should note that the flight to gold and precious metals has not been a straight line and these assets have seen considerable price volatility even since the war started. In particular, hikes in US interest rates and a lessening of geo-political tensions could start to dent their appeal as investors opt instead for assets that pay dividends and are driven by positive earnings.
2. Energy
S&P GSCI Energy Index: 8 Mar 2021 – 7 Mar 2022
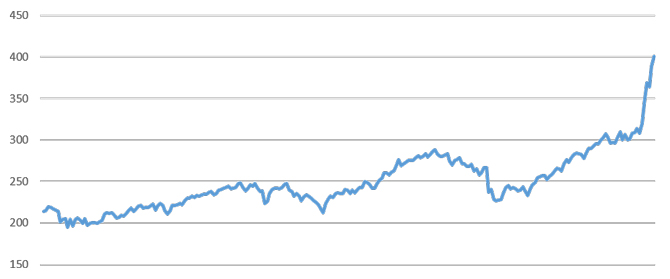
Source: S&P Dow Jones Indices
Russia exports around 7 million barrels per day (bpd) of crude and oil products combined, or 7 percent of global supply, making it the world's top exporter of crude and oil products combined. Separated out, Russia is the second largest gas, and the third largest oil producer, accounting for 17 percent and 12 percent of global output, respectively.
Recent news of US plans to ban Russia oil imports may not have a very significant impact on US supplies but have pushed prices up further. Now analysts’ targets of US$160, US$185 or even US$200 per barrel are being citied. These should be regarded cautiously as they typically represent possible high points rather than long term averages. That said, the trend of higher energy prices is unlikely to stabilise greatly even if hostilities subside. Prices would be expected to fall only if and when alternative supplies, such as from Iran, start to kick in.
3. Agricultural (soft) commodities
S&P GSCI Softs Index: 8 Mar 2021 – 7 Mar 2022
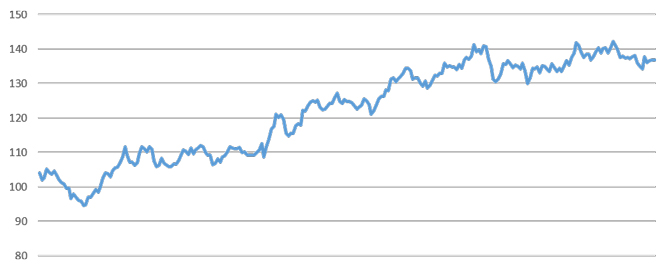
Source: S&P Dow Jones Indices
Investing in agricultural commodities are less popular because on top of supply shocks, it is necessary to consider planting intentions, weather and crop conditions. That said, both Russia and Ukraine are major exporters of agricultural commodities, especially wheat, corn and soybean. Normal flows from this region have been impeded by the war in Ukraine and Russian sanctions, exacerbating already higher prices due to post-Covid demand for food and inputs such as fertilizer, and poor weather in some areas.
As a result, crop futures prices have continued to rise and as of March 4, the May 2022 SRW (soft red winter) wheat futures price was up 50 percent from pre- Ukraine war prices. May futures prices for spring wheat and corn have also risen but by a more moderate 19 percent and 16 percent respectively. Assuming the war continues to disrupt agricultural activity in Ukraine and interrupt flows, it is likely that markets will seek alternative producers and ration extremely scarce supplies. However, prices are unlikely to normalize in the near term.
4. Infrastructure
S&P Global Infrastructure Index (US$): 8 Mar 2021 – 7 Mar 2022
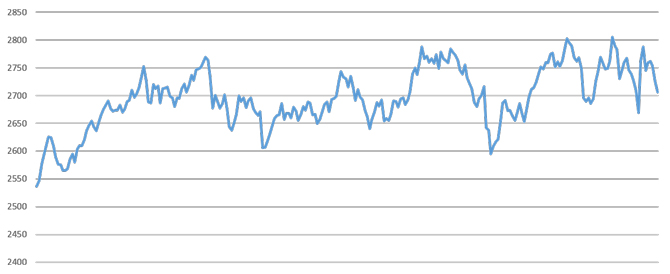
Source: S&P Dow Jones Indices
In a stagflation scenario when traditional asset classes are not performing well, investors may want to seek assets that can provide a full or partial inflation hedge. The high inflation backdrop is also an incentive to find assets that can pass-through higher prices into higher investment returns, such as global infrastructure.
Infrastructure spans the transport, utilities, energy, and telecommunications sectors that are essential to economic activities. In particular, the infrastructure complex includes investments in tangible assets. As such, it tends to enjoy high barriers to entry, and can maintain robust cash flows & income, even in a slower growth environment. Studies have shown that average quarterly returns for this sector is around 4.5 percent during periods of accelerating growth and still positive at 1.6 percent in periods of decelerating growth.
In addition, many infrastructure assets have an explicit link to inflation through regulation, concession agreements or contracts, or a more implicit link via their strong strategic positioning. However, the impact of such inflation hedges may require several years to be seen and therefore a longer investment time horizon may be required.
This publication shall not be copied or disseminated, or relied upon by any person for whatever purpose. The information herein is given on a general basis without obligation and is strictly for information only. This publication is not an offer, solicitation, recommendation or advice to buy or sell any investment product, including any collective investment schemes or shares of companies mentioned within. Although every reasonable care has been taken to ensure the accuracy and objectivity of the information contained in this publication, UOB Asset Management Ltd (“UOBAM”) and its employees shall not be held liable for any error, inaccuracy and/or omission, howsoever caused, or for any decision or action taken based on views expressed or information in this publication. The information contained in this publication, including any data, projections and underlying assumptions are based upon certain assumptions, management forecasts and analysis of information available and reflects prevailing conditions and our views as of the date of this publication, all of which are subject to change at any time without notice. Please note that the graphs, charts, formulae or other devices set out or referred to in this document cannot, in and of itself, be used to determine and will not assist any person in deciding which investment product to buy or sell, or when to buy or sell an investment product. UOBAM does not warrant the accuracy, adequacy, timeliness or completeness of the information herein for any particular purpose, and expressly disclaims liability for any error, inaccuracy or omission. Any opinion, projection and other forward-looking statement regarding future events or performance of, including but not limited to, countries, markets or companies is not necessarily indicative of, and may differ from actual events or results. Nothing in this publication constitutes accounting, legal, regulatory, tax or other advice. The information herein has no regard to the specific objectives, financial situation and particular needs of any specific person. You may wish to seek advice from a professional or an independent financial adviser about the issues discussed herein or before investing in any investment or insurance product. Should you choose not to seek such advice, you should consider carefully whether the investment or insurance product in question is suitable for you.