

Key Highlights
- Inflation is a major policy concern as we enter the new year
- US policymakers are uniting behind an accelerated rate hike cycle, with the first hike possible as early as March 2022
- There is potential for the US yield curve to flatten or even invert less than two years following the first rate hike.
Persistent inflation
As 2022 starts to unfold, one of the biggest topics of discussion is whether global central banks will bring forward their rate hike calendars. On the first trading day of the new year, US 2-year and 5-year Treasury yields reached their highest levels in nine months, a reflection of bond market fears that interest rate hikes could come in as early as March 2022. Fed funds futures are also pricing in a 70 percent chance of a rate hike by March, and a 100 percent chance by May.
These fears are being fuelled by stronger and stickier than anticipated inflation numbers. When inflation started to set off alarm bells in 2021, the US Federal Reserve pinned the problem on temporary kinks in the supply chain, and called the problem “transitory”. But the term is sounding hollow with year-on-year US Core Price Inflation (CPI) continuing its upward march, and is widely expected to exceed seven percent in December - the largest surge in nearly four decades.
Doves Back Down
Even uncertainties brought about by the rapid spread of the Omicron variant have not alleviated US policymakers’ inflation concerns. In fact, in recent weeks even those who had argued for more policy “patience”, including San Francisco Fed President Mary Daly, appear to have changed their minds.
Daly had earlier suggested that the labour crunch caused by the pandemic would gradually ease. However, more recent interviews suggest that she no longer supports a wait-and-see approach. She notes that delayed rate hikes run the risk of requiring more intensive, and therefore more potentially damaging, policy actions. Amid the current inflation trajectory, US policymakers seem to agree that sooner is better than later.
It had also been assumed that there would be an interval between completion of the Fed’s accelerated tapering programme - brought forward to March 2022 - and the first post-Covid rate hike. However, such is the level of concern that this interval is not deemed necessary and according to Fed Governor Christopher Waller, a March rate hike is now “very likely”.
Historical rate hike cycles
So assuming that a new rate hike cycle does kick off in March, what can bond investors expect to happen next? Looking back at the past 13 rate hike cycles since 1955, rate hikes averaged 4.7 percent over an average cycle period of about two years. If we focus in on rate hikes since 2000, these have averaged a more modest 2.75 percent.
Figure 1: US Rate Hike Cycles since 1955
| Hiking cycles | Length of Cycle (Months) | Total Hike (%) |
| 1955 – 1957 | 28 | 2.00 |
| 1958 - 1959 | 12 | 2.25 |
| 1963 - 1969 | 69 | 3.00 |
| 1972 - 1974 | 26 | 9.50 |
| 1976 – 1980 | 39 | 15.25 |
| 1980 – 1980 | 4 | 10.50 |
| 1983 – 1984 | 15 | 3.25 |
| 1986 – 1987 | 9 | 1.37 |
| 1988 – 1989 | 11 | 3.25 |
| 1994 – 1995 | 12 | 3.00 |
| 1999 – 2000 | 11 | 1.75 |
| 2004 – 2006 | 24 | 4.25 |
| 2015 – 2018 | 36 | 2.25 |
Source: UOBAM/Bloomberg
Typically, yields for 10-year Treasuries rise to an average of 111 basis points (bps) in the first year following the first rate hike and start to fall over the subsequent one or two years. In the case of the last hiking cycle, 10-year yields fell almost immediately.
Meanwhile 2-year and 5-year Treasury yields tend to remain relatively strong, such that steepening in the wake of rate hikes is very rare. To the contrary, US Treasury yield curves tend to flatten slightly in the first year following an interest rate hike. In six of the 13 cycles shown above, the curve proceeded to invert the following year, that is, short term rates exceeded long term rates. This is often a signal that a period of recession is on the cards. Where recessions have occurred, these have started on average 3.25 years after the timing of the first hike.
Flattening yield curve
Along with an earlier-than-expected start to the rate hike cycle, we believe that there is also a strong chance that this cycle may be faster than past ones. The Fed has communicated its hopes for the US economy to see “soft landing”, and all 18 policymakers have indicated their support for one rate hike before the end of 2022.
However, there is increasing consensus that given high employment rates, at least three rate rises in 2022 would be required to quell inflationary pressures. We note that the faster the pace of rate hikes, the sooner can the yield curve be expected to flatten, and we look to a flattening or inversion of the yield curve by 2023.
Figure 2: US Yield Curve After First Rate Hike
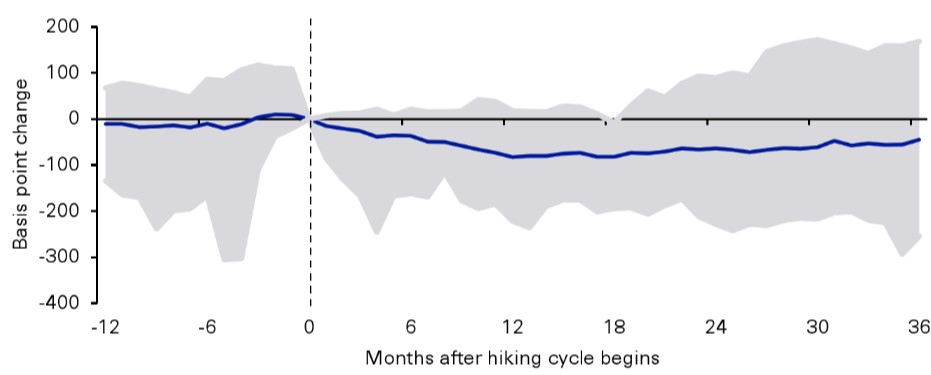
Source: UOBAM/Bloomberg
Over the last two cycles, the Fed has found it hard to continue hiking once this happens. As such, it is hard to see the Fed’s hiking cycle extending for too long this time round. At this point, we would regard rate hikes going into 2023 as very much shrouded in uncertainty.
This publication shall not be copied or disseminated, or relied upon by any person for whatever purpose. The information herein is given on a general basis without obligation and is strictly for information only. This publication is not an offer, solicitation, recommendation or advice to buy or sell any investment product, including any collective investment schemes or shares of companies mentioned within. Although every reasonable care has been taken to ensure the accuracy and objectivity of the information contained in this publication, UOB Asset Management Ltd ("UOBAM") and its employees shall not be held liable for any error, inaccuracy and/or omission, howsoever caused, or for any decision or action taken based on views expressed or information in this publication. The information contained in this publication, including any data, projections and underlying assumptions are based upon certain assumptions, management forecasts and analysis of information available and reflects prevailing conditions and our views as of the date of this publication, all of which are subject to change at any time without notice. Please note that the graphs, charts, formulae or other devices set out or referred to in this document cannot, in and of itself, be used to determine and will not assist any person in deciding which investment product to buy or sell, or when to buy or sell an investment product. UOBAM does not warrant the accuracy, adequacy, timeliness or completeness of the information herein for any particular purpose, and expressly disclaims liability for any error, inaccuracy or omission. Any opinion, projection and other forward-looking statement regarding future events or performance of, including but not limited to, countries, markets or companies is not necessarily indicative of, and may differ from actual events or results. Nothing in this publication constitutes accounting, legal, regulatory, tax or other advice. The information herein has no regard to the specific objectives, financial situation and particular needs of any specific person. You may wish to seek advice from a professional or an independent financial adviser about the issues discussed herein or before investing in any investment or insurance product. Should you choose not to seek such advice, you should consider carefully whether the investment or insurance product in question is suitable for you.