
Key Highlights
- Asian equities underperformed the US and Europe YTD, but rebounded in October
- China’s economic slowdown may be stabilising despite property sector uncertainties
- ASEAN markets show good promise as global funds return to the region
Good and bad news
Asian markets started this week with the usual mix of good and bad news. On the plus side, Chinese property company Evergrande managed to avoid defaulting on its most recent interest payments, giving some cheer to the broader markets. Meanwhile, a report released from the IMF downgraded its 2021 economic forecast for Asia from 7.6 to 6.5 percent, but stressed that the region would remain the fastest growing globally, led by China and India.
On the other hand, the 12-months earnings expectations of MSCI Asia Pacific companies fell for the first time in over a year. A fresh Covid outbreak in China has given rise to over 100 cases, with the possibility of renewed lockdowns. And news of a new property tax to be trialled in China weighed on an already-depressed property sector.
Bright Spots
It is this ongoing jumble of positive and negative news that has caused markets to stall for much of this year. Returns for the region are flat year-to-date, compared to the US’s 20 percent and Europe’s 15 percent upside.
Figure 1: Asia Vs US & European Equities, Year To Date
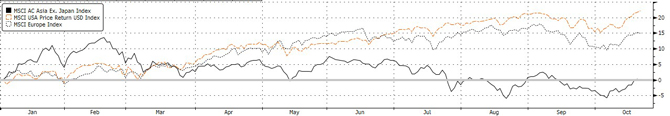
Source: UOBAM/Bloomberg, 22 October 2021
However, this underperformance masks some bright spots that have recently emerged. Asian equity markets that had been languishing started to pick up steam from end-September and to date, is 2.8 percent higher, comparable to the 3.5 percent lift In US equities over the same period. The main contributors to this rally were China (up 7.8 percent) and Indonesia (up 15.9 percent). The Korean and Taiwanese markets were the only detractors, down 4.9 and 2.0 percent respectively.
The improving Asian market sentiment can be traced to a few factors that can be deemed short term inflection points. The first is the stabilisation of measures stemming from China’s clampdown on big tech, property, education and other key economic sectors. While the establishment of “common prosperity” is clearly a multi-year (or even multi-decade) project, there are signs that many recently-introduced measures are no longer accompanied by severe sector turbulence. Rather, the early shocks have evolved into a more institutionalised phase, with companies now settling into the regulatory changes.
Another indication that Asian markets may have reached a trough comes from the fact that more daring investors have started to bottom-fish the Chinese property sector. Those developers with strong balance sheets have seen their stocks rebound, even while highly leveraged developers remain under stress.
But even Asian sectors not ravaged by selldowns appear reasonable in terms of their price-to-earnings (PER) and price-to-book ratios (PBR). Relative to the PER for S&P500 companies of around 28 times, Asian companies are averaging just 16 times, with India as the outlier.
Figure 2: PER 2021E & 2021E
| PER 2021 E (x) | PER 2022 E (x) | |
| Asia ex Japan | 15.6 | 14.3 |
| China | 15.6 | 13.6 |
| India | 29.1 | 23.7 |
| Indonesia | 18.6 | 15.5 |
| Korea | 10.1 | 10.3 |
| Malaysia | 14.4 | 14.8 |
| Thailand | 21.2 | 18.9 |
| Singapore | 17.1 | 15.0 |
Source: UOBAM/MSCI/Factset/Bloomberg, 22 October 2021
ASEAN markets lead the way
As we noted in our Quarterly Investment Strategy, ASEAN equity markets show higher potential for a turnaround than those in North Asia. Malaysia, Thailand and Indonesia are now past the worst of their Covid crises and are re-opening their economies amid relatively high vaccination rates. Malaysian and Indonesian blue chips have seen strong support since the end-September, driven by global fund flows, and Thai companies look set to follow suit.
The Singapore market has also shown surprising resilience despite the recent jump in Covid infection rates. This confidence follows Singapore’s robust 6.5 percent growth in the third quarter compared to a year ago, driven primarily by the construction sector. The central bank expects “above-trend” growth to continue in coming quarters and the IMF agrees, upgrading Singapore’s 2021 GDP forecast from 5.2 to 6.0 percent.
The ASEAN and China equity markets have survived nine months of negative news flows and now appear poised to perform better. Risk-reward considerations weighed against Asian markets but a lifting of its Covid, policy clampdown and trading uncertainties has changed the equation. Coupled with attractive valuations, there seems to be some light at the end of the tunnel for Asian markets.
This publication shall not be copied or disseminated, or relied upon by any person for whatever purpose. The information herein is given on a general basis without obligation and is strictly for information only. This publication is not an offer, solicitation, recommendation or advice to buy or sell any investment product, including any collective investment schemes or shares of companies mentioned within. Although every reasonable care has been taken to ensure the accuracy and objectivity of the information contained in this publication, UOB Asset Management Ltd (“UOBAM”) and its employees shall not be held liable for any error, inaccuracy and/or omission, howsoever caused, or for any decision or action taken based on views expressed or information in this publication. The information contained in this publication, including any data, projections and underlying assumptions are based upon certain assumptions, management forecasts and analysis of information available and reflects prevailing conditions and our views as of the date of this publication, all of which are subject to change at any time without notice. Please note that the graphs, charts, formulae or other devices set out or referred to in this document cannot, in and of itself, be used to determine and will not assist any person in deciding which investment product to buy or sell, or when to buy or sell an investment product. UOBAM does not warrant the accuracy, adequacy, timeliness or completeness of the information herein for any particular purpose, and expressly disclaims liability for any error, inaccuracy or omission. Any opinion, projection and other forward-looking statement regarding future events or performance of, including but not limited to, countries, markets or companies is not necessarily indicative of, and may differ from actual events or results. Nothing in this publication constitutes accounting, legal, regulatory, tax or other advice. The information herein has no regard to the specific objectives, financial situation and particular needs of any specific person. You may wish to seek advice from a professional or an independent financial adviser about the issues discussed herein or before investing in any investment or insurance product. Should you choose not to seek such advice, you should consider carefully whether the investment or insurance product in question is suitable for you.