

Key Highlights
- Investors are caught between fears of more rate hikes and a global recession
- The mounting risk aversion may give way to more short term volatility in Asian markets
- But positive momentum is building, with China likely to lead the Asian recovery
Asian markets wobble as slowdown fears bite
Asian market volatility has increased as investors grapple with the news that the US Fed’s rate hikes – three so far this year – have failed to quell inflationary pressures. Last week’s announcement saw new records broken with US inflation for June registering a 40-year high of 9.1 percent compared to a year ago.
This means that more rate hikes are inevitable, the only debate is by how much and for how much longer. However, the uncertainty surrounding whether world economies are due for a soft or hard landing appears to be entering a new phase, to the detriment of Asian markets. While many had managed to withstand the crisis, there are signs their resilience will be increasingly tested over the next few months.
Year to date, north Asian stock markets such as Korea and Taiwan have foregone their outperformance of the US’s S&P 500. All three markets are down by around 20 percent, technically defined as a bear market. Meanwhile ASEAN markets such as Indonesia and Malaysia are flat for the year. They were previously buoyed by their commodity exports, but have been under selling pressure since the end of June.
Companies hurt by tech and commodity price corrections
The Korea and Taiwan markets are tech-heavy and as such are following in the footsteps of the Nasdaq Composite, which has fallen by close to 30 percent year-to-date. In the face of a potential slowdown in global consumer demand for smartphone and PCs, investors are increasingly wary of Asian semiconductor and electronics companies.
Profit growth of over 76 percent achieved by the world’s largest contract chipmaker, Taiwan Semiconductor Manufacturing Co. (TSMC), in 2Q 2022 did help allay some fears. However, the company has also warned of clients’ excessive inventory, raw material supply bottlenecks and higher expenses over the next few quarters going into 2023, as have other major chipmakers such as Micron and Intel. Year-to-date, TSMC’s share price has fallen by over 20 percent.
Meanwhile, ASEAN markets are contending with a different but related issue – falling commodity prices. In particular, Malaysia and Indonesia had enjoyed a boost due to its exposure to commodities such as palm oil. Supply constraints of palm oil and alternative vegetable oils had led to a record-high price rise in the first half of the year.
Figure 1: Palm oil prices (MYR/T). Oct 202
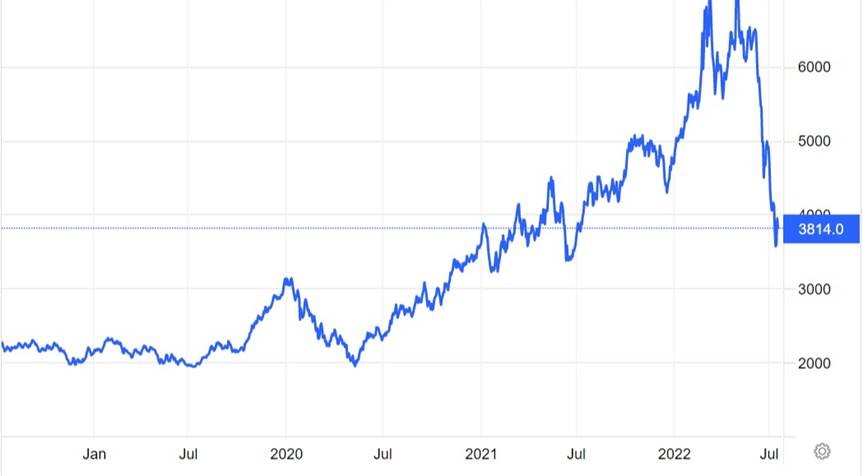
Source: trading Economics/ UOBAM
This has reversed dramatically in the wake of Indonesia’s reduced import levies and expectations of increased vegetable oil supplies As a result, Singapore-based Wilmar International, the world’s largest palm oil producer, has seen its stock price weaken by 17 percent since its March 2022 high. Palm oil price weakness is expected in the coming months until some supply-demand normalisation is achieved, and global recession fears recede.
USD strength is adding to the outflow
Another contributor to the Asian market weakness is the unstoppable rise of the USD. Against a basket of other foreign currencies, the dollar (DXY index) has gained by 11 percent this year, and is currently at a 20-year high. In recent weeks it has crossed various thresholds, including a 24-year high against the Japanese yen, and a one-for-one parity with the euro. Asian currencies have weakened by between 4 – 10 percent against the USD since the start of the year.
Economists cite several reasons for the strong dollar. First and foremost, the US Fed’s aggressive rate rises make it attractive for investors to hold their assets in USD. However, recession fears and risk aversion is playing its part. As the world’s most important and liquid currency, the USD appeals to investors during times of global economic uncertainty. The US is also seen to be a more stable economy amid the current pressures imposed by higher oil prices and geo-political uncertainties.
Figure 2: DXY index vs MSCI AC Asia ex Japan (MXASJ) index: 2017 – 2022
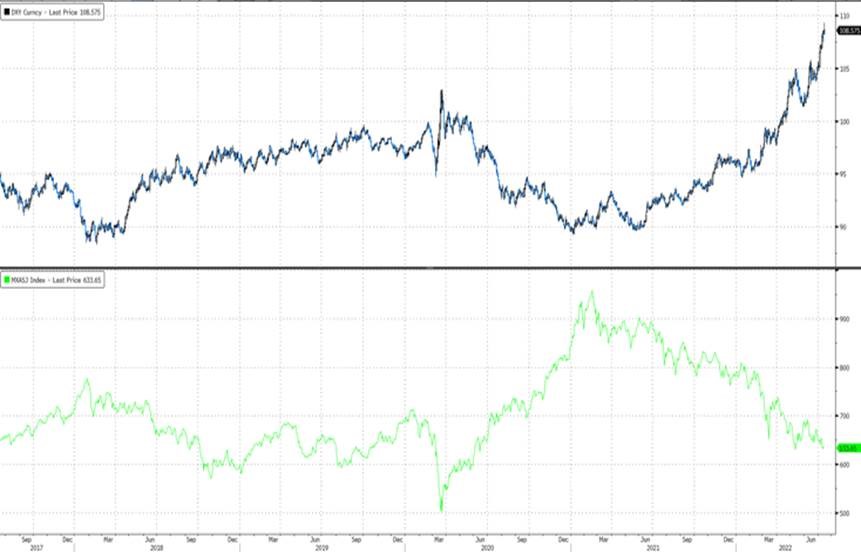
Source: Bloomberg/UOBAM, 15 July 2022
As such, USD strength is typically inversely correlated to Asian market performance ie when the USD rises, Asian markets decline and vice versa. This has been strongly demonstrated since the start of year, and further strengthening of the dollar can be expected to accelerate flows out of Asian assets such as bonds and equities. On the other hand, a slowdown in the current USD rise could signal a turning point for Asian markets.
China to spearhead Asia’s recovery
China is an equity market outperformer, So far this year, the Shanghai Stock Exchange (SSE) Composite Index has fallen by only 9 percent, despite crippling Covid lockdowns and no end to its property sector crisis. The country barely registered any GDP growth in 2Q – compared to 3 percent growth in 1Q – and is unlikely to hit its 5.5 percent full-year growth target. Nevertheless, there are reasons to expect that China will help lead the Asian market recovery.
The country’s manufacturing and industrial production has rebounded from April’s low across most segments but especially in automobiles, electric machinery and equipment, and electronics. Meanwhile the resumption of activities post-lockdowns helped services production and retail sales to turn the corner in June. These grew by 1.3 and 3.1 percent respectively compared to a year ago and is supportive of an economic and market recovery in the second half of the year.
That said, 2. China’s property sector is not out of the woods yet. The sector continues to struggle under the weight of deteriorating fixed asset investments, declining residential and land sales, and less construction activities. Overall, Chinese property developers still face deep contraction, as well as deleveraging and liquidity pressures.
Asian equities offer upside potential for patient investors
Over the near term, our outlook for the Asia equites market is mixed amid the uncertain global macro environment outlined above. Downward revisions to growth expectations due to supply shocks and depressed consumer sentiment is only starting to play out in several Asian economies, As such, the bottom may not yet be in place.
However, Asian equity market valuations are looking attractive, and will become even more so following any further near-term corrections. There are signs that the region’s inflation momentum may be slowing ahead, while its economic and earnings momentum may pick up further given Covid re-openings and policy support. The short term uncertainties underscore our continued defensive tilt towards non-cyclical and value sectors such as energy, materials and financials. But over the longer term, we see a return to more growth-biased opportunities, led by select China equities.
This publication shall not be copied or disseminated, or relied upon by any person for whatever purpose. The information herein is given on a general basis without obligation and is strictly for information only. This publication is not an offer, solicitation, recommendation or advice to buy or sell any investment product, including any collective investment schemes or shares of companies mentioned within. Although every reasonable care has been taken to ensure the accuracy and objectivity of the information contained in this publication, UOB Asset Management Ltd (“UOBAM”) and its employees shall not be held liable for any error, inaccuracy and/or omission, howsoever caused, or for any decision or action taken based on views expressed or information in this publication. The information contained in this publication, including any data, projections and underlying assumptions are based upon certain assumptions, management forecasts and analysis of information available and reflects prevailing conditions and our views as of the date of this publication, all of which are subject to change at any time without notice. Please note that the graphs, charts, formulae or other devices set out or referred to in this document cannot, in and of itself, be used to determine and will not assist any person in deciding which investment product to buy or sell, or when to buy or sell an investment product. UOBAM does not warrant the accuracy, adequacy, timeliness or completeness of the information herein for any particular purpose, and expressly disclaims liability for any error, inaccuracy or omission. Any opinion, projection and other forward-looking statement regarding future events or performance of, including but not limited to, countries, markets or companies is not necessarily indicative of, and may differ from actual events or results. Nothing in this publication constitutes accounting, legal, regulatory, tax or other advice. The information herein has no regard to the specific objectives, financial situation and particular needs of any specific person. You may wish to seek advice from a professional or an independent financial adviser about the issues discussed herein or before investing in any investment or insurance product. Should you choose not to seek such advice, you should consider carefully whether the investment or insurance product in question is suitable for you.
UOB Asset Management Ltd. Company Reg. No. 198600120Z